

The claim under test is simple and loud: AI does the junior work first, so firms stop hiring juniors, and the bottom rung of white-collar ladders comes off. Stanford's payroll study found the first-stage symptom in 2023 to 2025 employment. This paper asks whether the symptom is visible in hiring intent, in every job posting Revelio Labs captured worldwide over the two years in which agentic models arrived, with a design that cannot mistake a sector slump, a seasonal cycle, or a change in data coverage for a broken rung.
In short, it is not visible yet. Exposed occupations posted more jobs, not fewer; their junior-titled postings did not fall behind their senior-titled postings; their low-pay postings grew relative to their high-pay postings; and the pay offered in them drifted down relative to other occupations. Layoffs tilted toward exposed firms in the 2023 wave and tilted back after the agentic wave. If AI is pressing on these occupations in 2024 to 2026, it shows up first in the price of a posting, not in the count of junior postings. Every number below carries a confidence tag, and the limitations section says what this cannot show.
Parts II and III (added November 2026) push the window back to 2019 and add people to postings. With 2.53 billion postings from July 2019, exposed occupations' LinkedIn-sourced postings fell by more than half relative to unexposed ones through 2023 to 2025 and recovered in 2026, but the decline is a computer-occupations story that began before ChatGPT, within occupation groups it is a quarter with an interval reaching zero, two of three seniority measures show no tilt against juniors, while Revelio's own seniority field, which now runs to May 2026, shows a within-occupation tilt of about -16 points in exposed computer and IT occupations from 2024 on that the title measure does not confirm; offered pay fell. In the sources that reach back to 2019, the exposed-occupation gradient moved by ChatGPT-sized amounts between 2019 and 2022 for reasons that had nothing to do with AI (the COVID shock and coverage drift), which is the scale against which the 2023 decline has to be read. In Revelio's firm-level headcount for 5,348 public firms, AI-exposed firms became more junior-heavy after ChatGPT, by shedding senior staff, and the one broken-rung signal in the data, a smaller junior share of new hires at exposed firms, lasted about eighteen months from late 2022 and had reversed by 2026.
Main findings
Each row is one design: what was held constant, what the data showed, and how I read it. "Exposed" means a high score on the Eloundou et al. rating of how much of an occupation's work a language model could do; "junior" and "senior" are defined in Section 3.
| Controlling for | Result | Interpretation | Confidence |
|---|---|---|---|
Everything that hits an occupation in a given month (sector cycles, rate shocks, Revelio coverage changes), everything that hits all junior postings at once (internship seasons, an economy-wide junior freeze), and each occupation's permanent junior/senior mix; estimated within posting source | Title tiers: junior-titled vs senior-titled postings in exposed occupations changed by β = -0.42 log points per unit exposure per year (s.e. 0.28); -0.03 when occupations are weighted by size; +0.30 with the Anthropic index; +0.013 with AIOE. 145 occupations. | Junior-titled postings did not fall behind senior-titled postings in exposed occupations. No broken rung in hiring intent, within the power of the test. | medium |
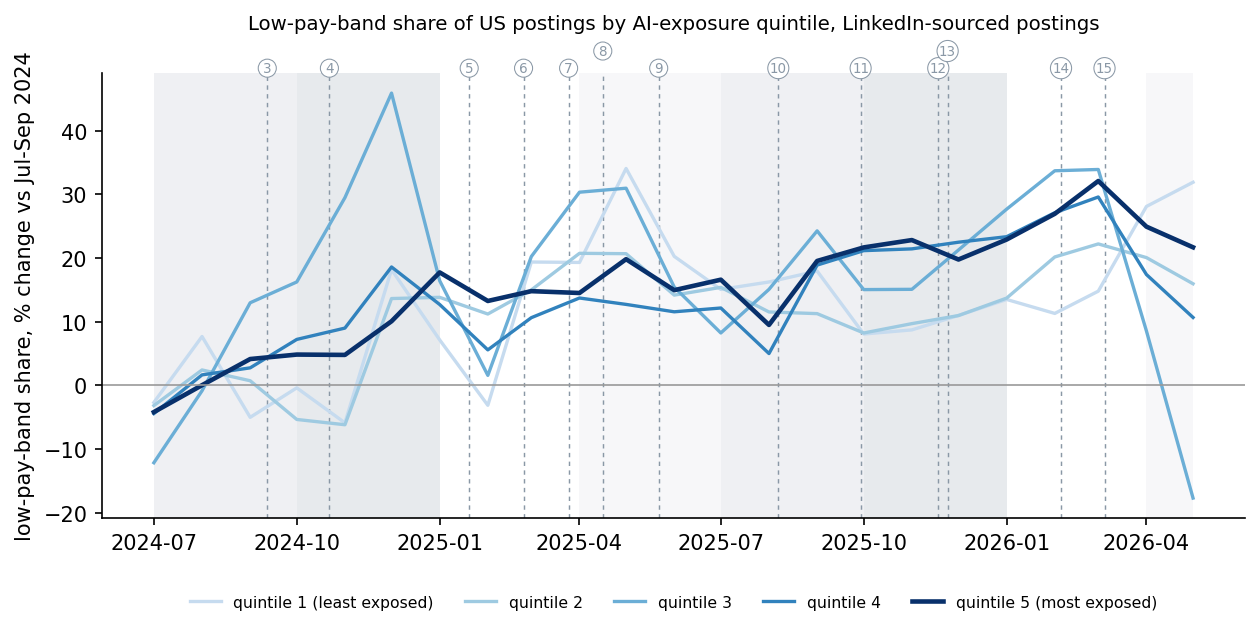
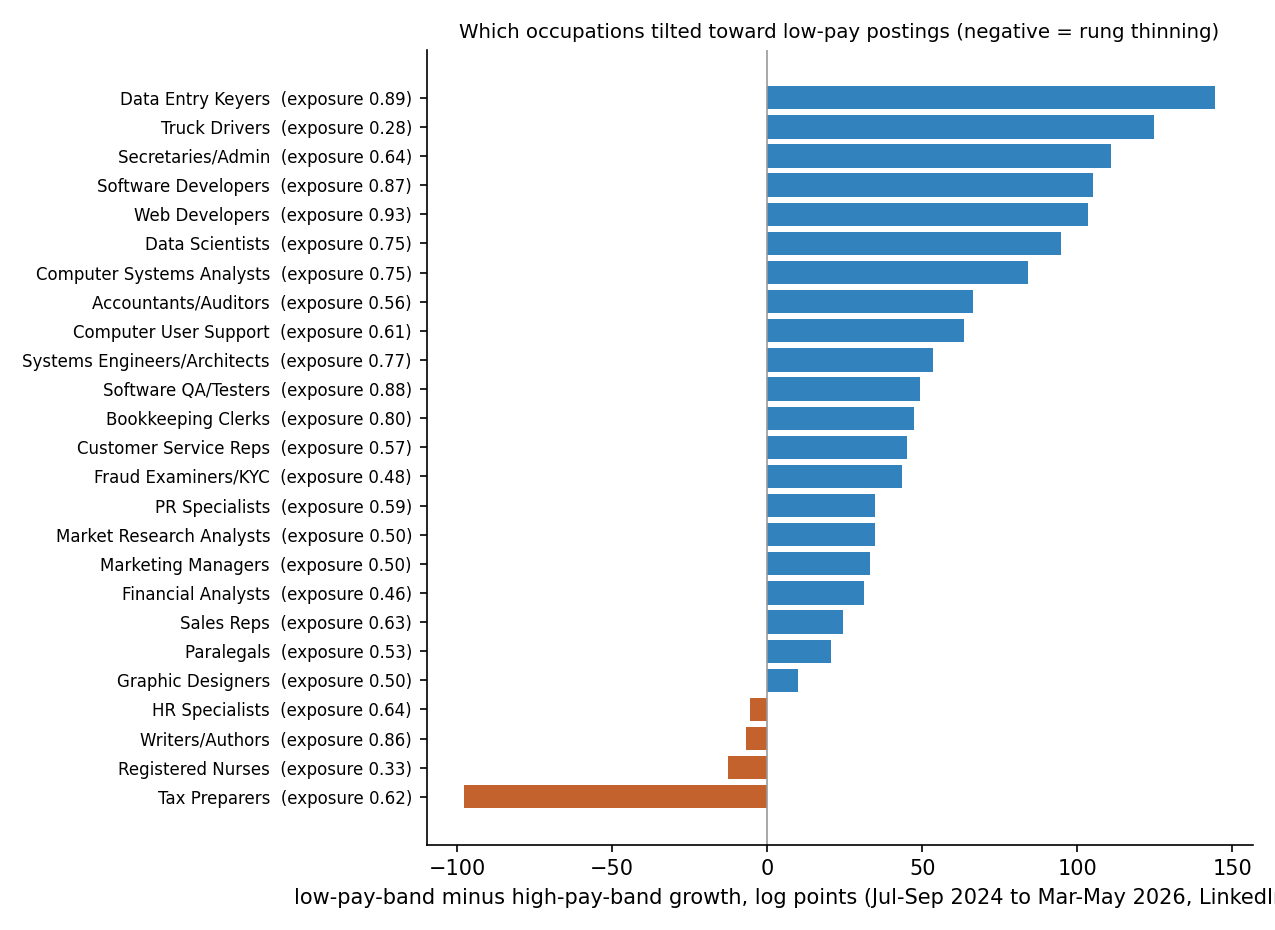
The same controls, with tiers defined by pay band instead of title | Low-pay-band vs high-pay-band postings in exposed occupations: β = +0.09 (s.e. 0.05) pooled; +0.17 (s.e. 0.06) in LinkedIn-sourced postings; +0.15 (s.e. 0.06) year-over-year. 894 occupations. | Low-pay postings in exposed occupations grew relative to high-pay postings. Part of this is pay, not headcount: offered salaries in exposed occupations fell relative to others, which moves postings between bands. The direction is the opposite of a broken rung either way. | medium |
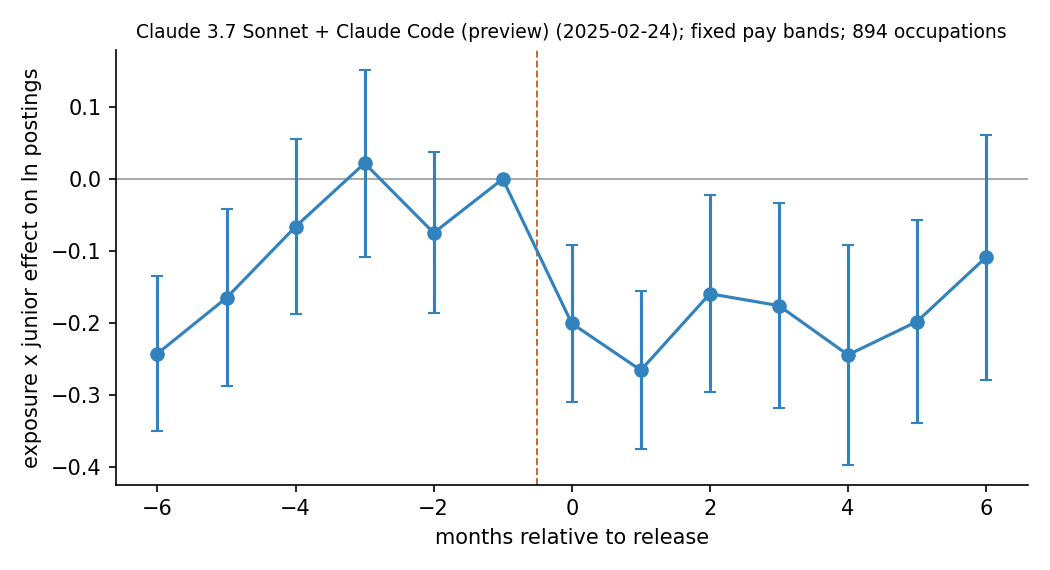
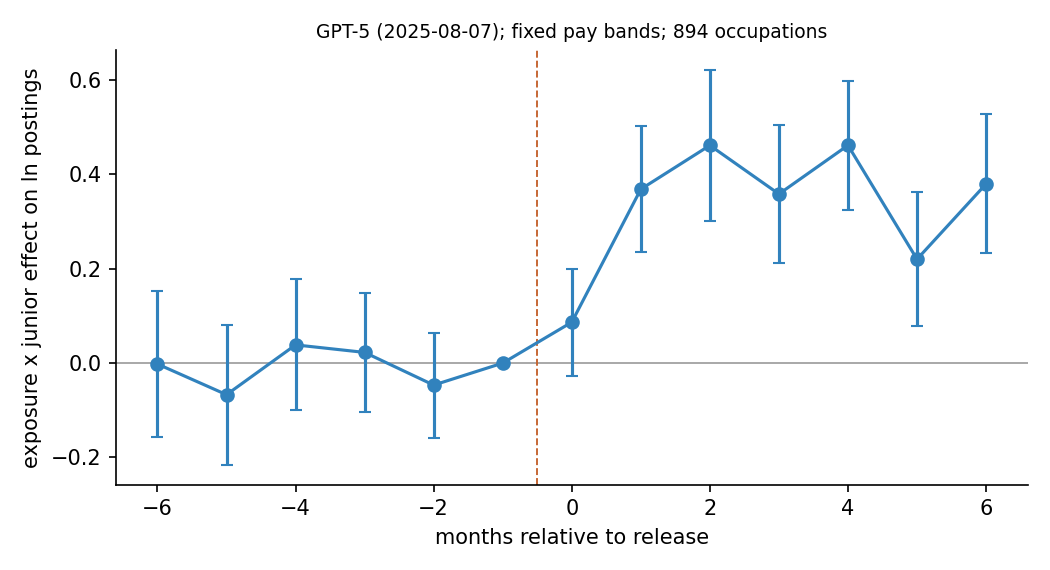
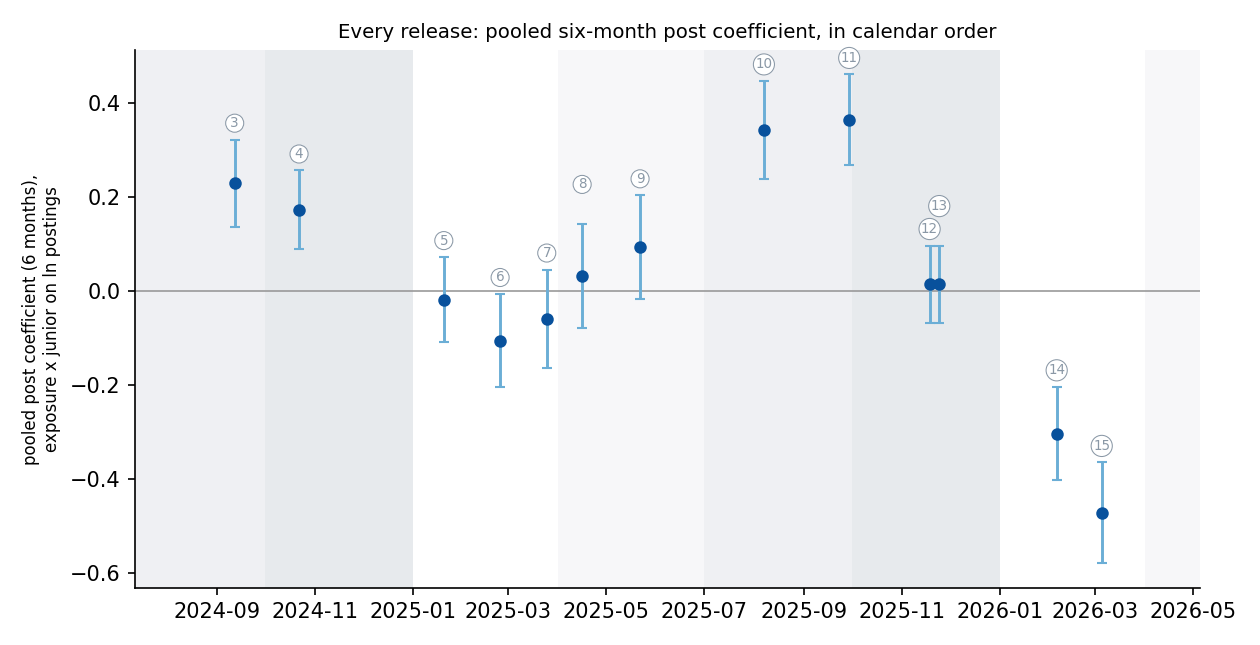
Same controls, month-by-month around each major model release | 13 releases from o1-preview to GPT-5.4: pooled post-release coefficients range -0.47 to +0.36 with no consistent sign; pre-release months are as jagged as post-release months. | No release produced a step change in junior-vs-senior composition. Capability jumps did not translate into immediate hiring-mix changes. | medium |
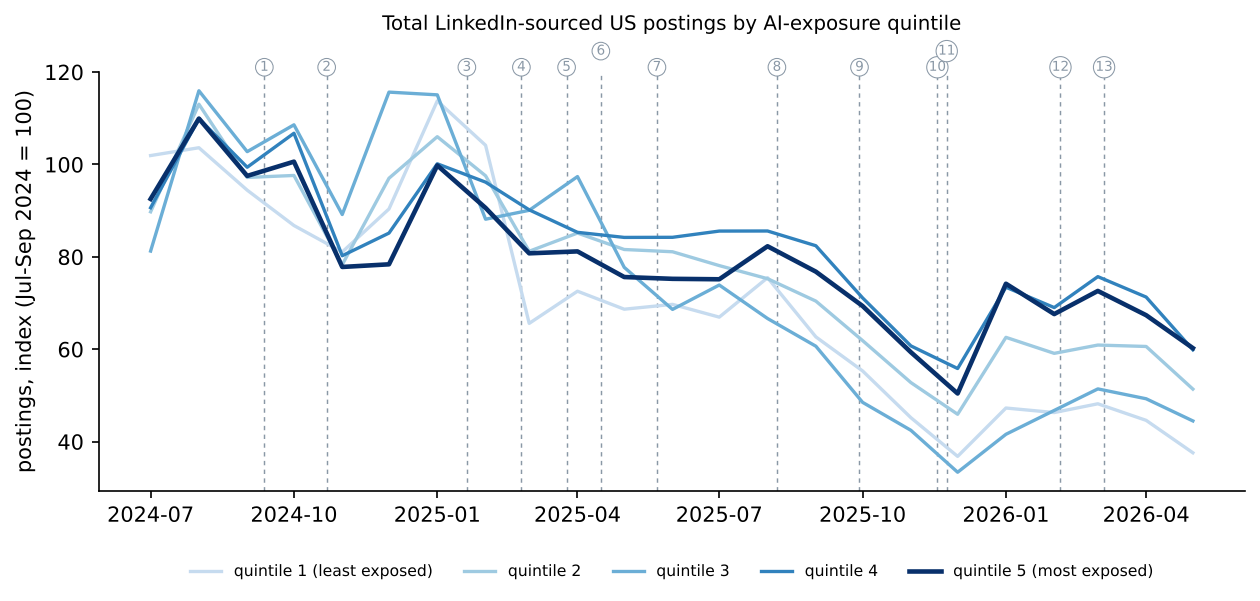
Each occupation's level and each month's level, within source | Total postings in exposed occupations grew +0.32 log points per unit exposure per year relative to unexposed (s.e. 0.05); +0.22 in LinkedIn-sourced and +0.42 in other postings. 917 occupations. | Exposed occupations gained postings relative to unexposed ones over the window. Consistent with demand expansion for AI-using work, and also with a cyclical white-collar rebound; the data cannot separate the two without a pre-2024 baseline. | low to medium |
Each occupation-tier-month cell and its source; LinkedIn-sourced postings with a stated salary only | Stated salaries in exposed occupations fell -0.049 log points per unit exposure per year relative to others (s.e. 0.022); junior offers fell a further -0.093 relative to senior offers (s.e. 0.038). | Pay offered in exposed occupations drifted down relative to other occupations, and junior offers drifted down relative to senior offers. If AI is pressing on these occupations in 2024 to 2026, it shows up in the price of a posting before the count of postings. | low to medium |
Each firm's own baseline and each month; firm exposure measured from the firm's own posting mix | Low-pay share of a firm's postings: -4.5 pp per unit firm exposure per year (s.e. 0.8), 15,092 firms; with title tiers -0.3 pp (s.e. 0.5). | Exposed firms shifted their posting mix away from low-pay roles faster than unexposed firms. With title tiers there is no such shift, so this is again more pay than headcount. | medium |
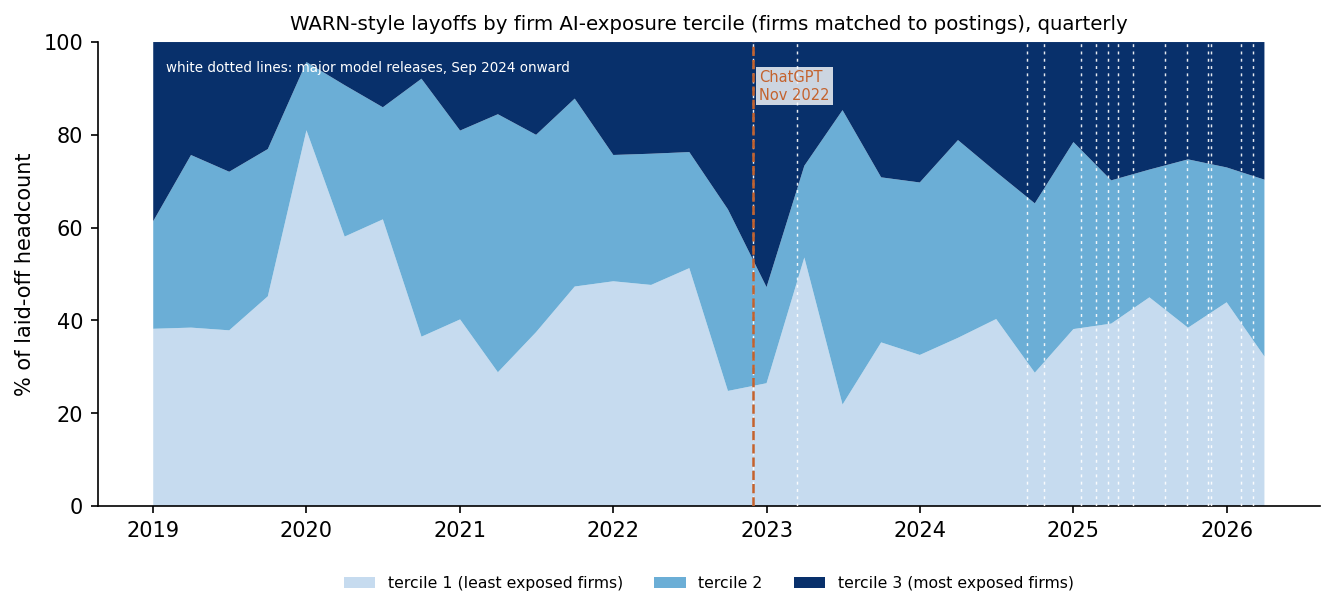
Each firm's long-run layoff propensity and each month; firms with any WARN-style layoff since 2019 | Monthly layoff probability at exposed firms: +5.6 pp per unit exposure after Dec 2022 (s.e. 0.5), then -1.8 pp after Mar 2025 (s.e. 0.6); 5,695 firms, 1990 to 2026. | Exposed firms laid off more than their own history after ChatGPT (the 2023 tech wave), and that excess receded after the agentic wave of 2025. Layoffs at exposed firms did not accelerate as agents arrived. | medium |
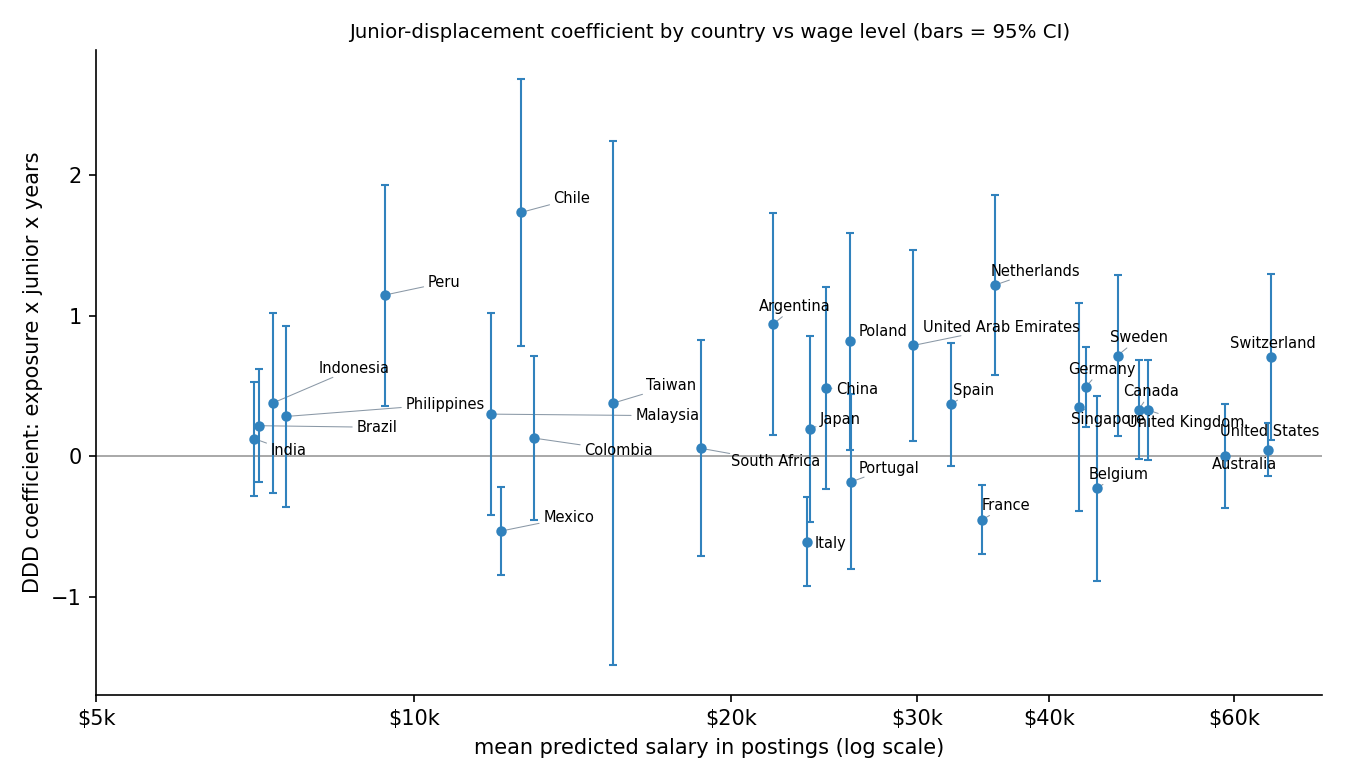
The same triple difference run separately in each of 30 countries | Country-level β against log wage level: slope +0.040; 3 of 30 countries significantly negative, 9 significantly positive; US +0.05. | Junior displacement is not stronger where human labor is more expensive. The "cheaper than a machine" prediction gets no support in postings. | medium |
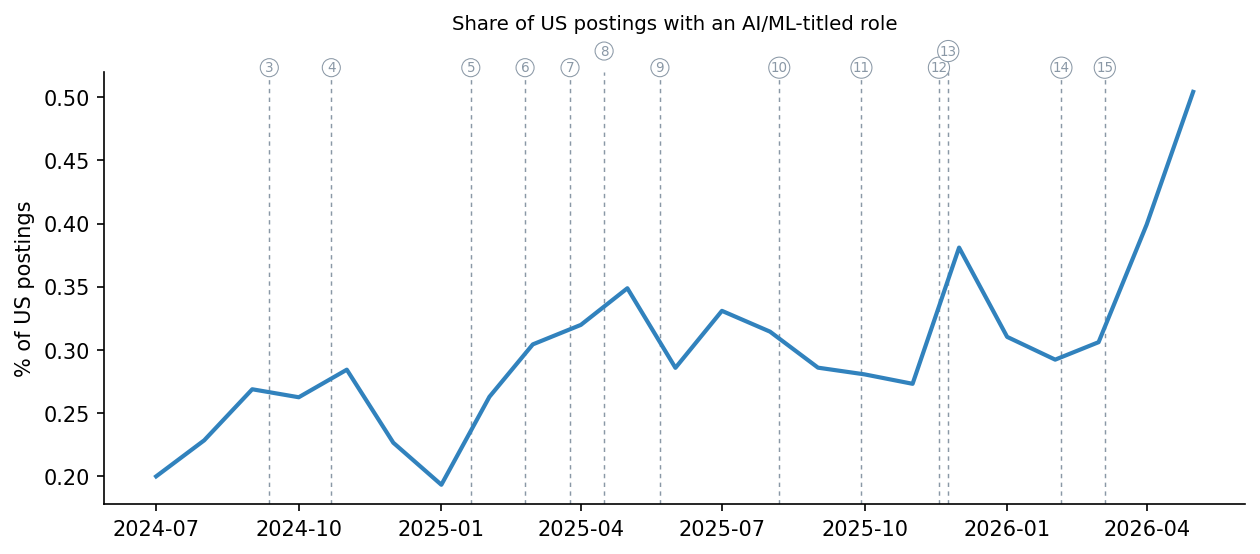
Nothing (descriptive share) | AI/ML-titled roles: 0.20% of US postings in Jul 2024 to 0.50% in May 2026. | AI- and ML-titled hiring more than doubled from a small base. | high |
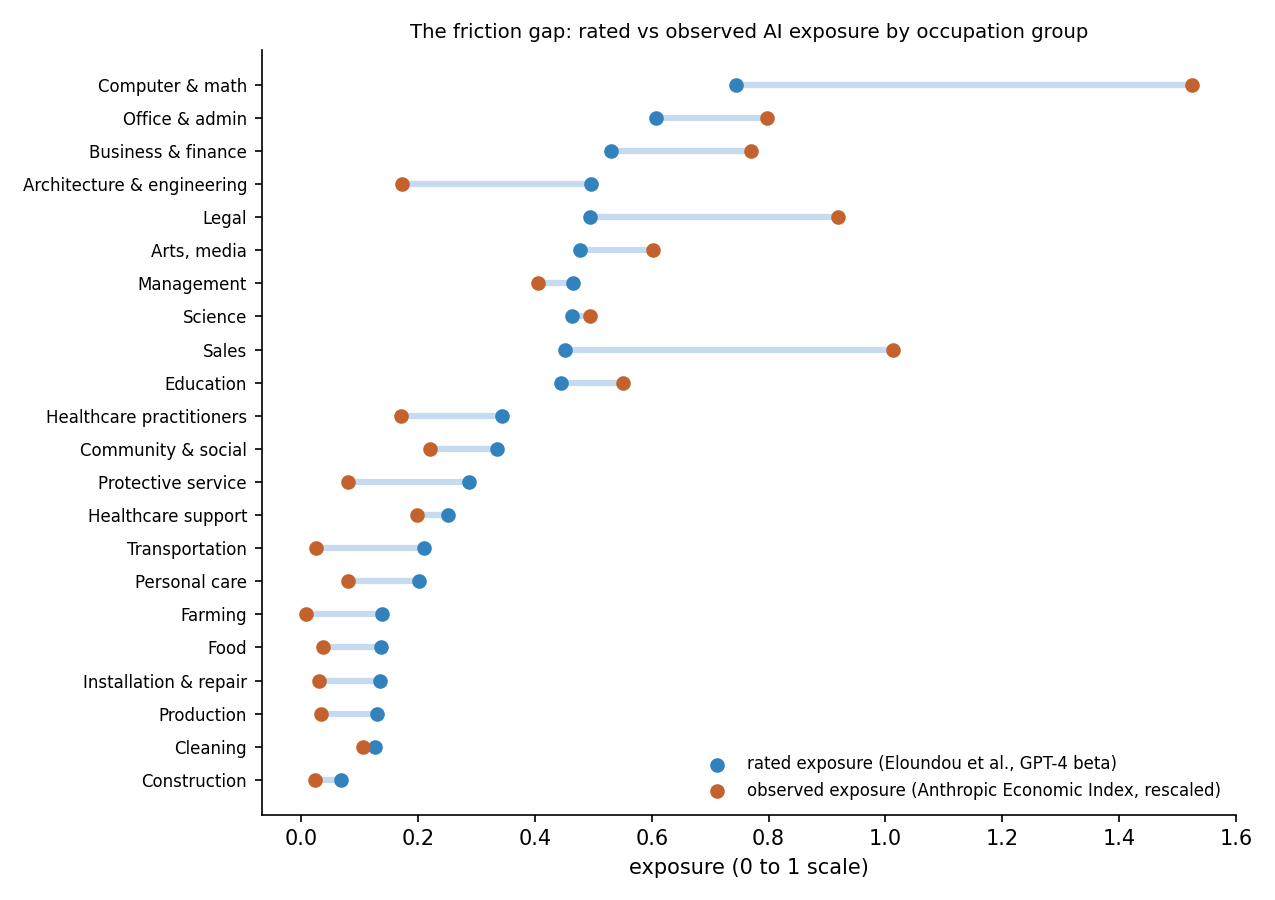
Nothing (cross-section of occupations) | Rated vs observed exposure correlate 0.63 across 876 occupations; observed use exceeds ratings in computer, legal, sales and finance work and falls short in engineering, transport, protective service and production. | Where errors are physical, licensed or supervised, actual AI use runs far below what the ratings say is possible. The gap is friction, not capability. | high (descriptive) |
Click a column heading to sort.
1. Why this question, now
Three things happened between mid-2024 and mid-2026. Frontier models went from chat to agents: computer use (Oct 2024), reasoning models (o1, R1), and coding agents that ship software (Claude Code, Feb to May 2025), followed by GPT-5, Sonnet 4.5, Opus 4.5 and 4.6, GPT-5.4 and the Claude 5 generation. Second, the labor-economics literature produced its first credible displacement evidence: Brynjolfsson, Chandar and Chen (2025) used ADP payroll records and found a roughly 13% relative employment decline for 22 to 25 year olds in the most AI-exposed occupations, with older workers unaffected high: published paper. Third, the public argument escalated. Anthropic's CEO said in May 2025 that AI could eliminate half of entry-level white-collar jobs within one to five years high: on-record interview, Axios, May 2025; MIT's Iceberg Index put the technically exposed share of US wage value at about 11.7% medium: press coverage of the Nov 2025 release.
Payroll data shows who was employed. Postings show who firms were trying to hire, months earlier and at occupation resolution. If the broken rung is a hiring decision, it should appear in postings first. That is the test.
2. Data
Revelio Labs job postings via Wharton's WRDS subscription: two extracts, June 2024 to June 2025 (72.8 GB, 483.9M rows) and June 2025 to June 2026 (122.5 GB, 837.6M rows), 1.32 billion postings after removing the 2.65M duplicates where the extracts overlap. Every row carries an O*NET-SOC occupation code, a normalized role title (Revelio's 17,000-category taxonomy), country, firm identifier, predicted salary, stated salary where posted, expected hires, and source flags (LinkedIn vs company sites and aggregators). The slim schema has no seniority field, no metro, and no posting text. US postings: 356.5M. Also used: 62,601 WARN-style layoff tranches 1990 to 2026 with firm identifiers, and the Anthropic Economic Index, Eloundou et al. and Felten exposure files (public).
Processing: one streaming pass per extract with DuckDB into columnar parquet (about 10 minutes on an 18-core laptop for 195 GB), then monthly cells by country, occupation, pay band, title tier and source. The histogram of predicted pay per occupation-month is stored, so any pay-band definition can be recomputed without re-reading the raw files. Code and aggregates are described in the reproducibility note.
Download
3. Measuring seniority without a seniority field
Two constructions, both reported.
- Fixed real pay bands (primary). Revelio's predicted salary is present on 99% of US postings and correlates 0.95 in logs with stated salary where both exist. For each occupation and source, the 33rd and 67th percentiles of predicted pay over July to December 2024 define a low band and a high band; the thresholds grow at 3.5% a year so nominal wage growth does not move postings across bands. "Junior" is a posting in the low band, "senior" one in the high band. Validation on postings whose titles state seniority: in software development 94% of intern/junior-titled postings fall in the bottom tercile and 68% of senior/lead-titled postings in the top; for lawyers 82% and 50%; for financial analysts 82% and 11% (analyst ladders are flat). The band is a pay proxy for rung, and it works where the ladder is steep.
- Title keywords (secondary). Intern, entry, junior, trainee, apprentice, graduate vs senior, lead, principal, staff, manager, director, head, VP, chief. Covers about 15% of US postings, is dominated by a few very large categories (one tax-traineeship family alone), and is strongly seasonal. Reported for completeness.
A third candidate, within-year pay terciles, was tried and discarded: it drifts with wage growth inside each year and resets at year boundaries, which produced sign flips in release event studies that disappear under the fixed-band definition.
4. Design
The unit is an occupation (O*NET), a tier (junior or senior), a posting source, and a month; the outcome is the log of postings in the cell. Exposure is the Eloundou et al. (2024) GPT-4-rated beta score (0 to 1), with the Anthropic Economic Index observed exposure and the Felten AIOE index as alternatives. The estimating equation is a triple difference:
- where
- Postings in the cell. The outcome is its log.
- Occupation, on the O*NET-SOC taxonomy.
- Tier: junior or senior, by pay band or by title.
- Posting source: LinkedIn, or company sites and aggregators.
- Month.
- Each occupation's permanent junior/senior mix, within source.
- Anything hitting an occupation in a month, juniors and seniors alike: a sector slump, a rate shock, a coverage change.
- Anything hitting all juniors at once, including internship seasons and an economy-wide junior freeze.
- Eloundou et al. (2024) GPT-4-rated beta score, 0 to 1.
- One for the junior tier, zero for the senior tier.
- Time in years, so β is an annual rate.
- The extra annual log change in junior postings relative to senior postings for a fully exposed occupation against an unexposed one. A broken rung is β well below zero.
- Residual. Standard errors are clustered by occupation, 800 to 900 clusters.
The occupation-month-source effect absorbs anything that hits an occupation in a month, juniors and seniors alike: a sector slump, a rate shock, a change in how many postings Revelio captured for that occupation from that source. The tier-month-source effect absorbs anything that hits all juniors at once, including internship seasons and an economy-wide junior freeze. β is identified only by junior postings moving relative to senior postings in the same occupation, more so in exposed occupations, over time. A year-over-year variant adds occupation-tier-calendar-month effects so that only within-calendar-month changes between 2024 to 25 and 2025 to 26 identify β. Standard errors are clustered by occupation (800 to 900 clusters). Post-period dummies (March 2025, the agentic coding wave; August 2025, GPT-5) and event-time fans around each major release are estimated on the same panel.
5. Results
5.1 Occupation level
Title tiers. On the 145 occupations with enough junior- and senior-titled postings in every month, β = β = -0.42 (s.e. 0.28, p = 0.14). Weighted by baseline postings it is -0.03 (s.e. 0.53); with the Anthropic Economic Index as the exposure measure +0.30 (s.e. 0.27); with the Felten AIOE index +0.013 per s.d. (s.e. 0.045). Nothing here is distinguishable from zero and the signs disagree across measures. Comparing only the most and least exposed quintiles, junior-titled postings in the most exposed occupations grew faster after March 2025 (+0.31 log points, s.e. 0.08, 72 occupations).
Pay-band tiers. On 894 occupations:
| Specification (US, fixed real pay bands) | β | s.e. | p | occupations |
|---|---|---|---|---|
Eloundou GPT-4 beta, all sources, trend | +0.086* | 0.048 | 0.07 | 894 |
Eloundou GPT-4 beta, all sources, trend, weighted by baseline postings | +0.013 | 0.125 | 0.91 | 894 |
Eloundou GPT-4 beta, all sources, year-over-year (occ × tier × calendar-month FE) | +0.149*** | 0.055 | 0.01 | 894 |
Anthropic Economic Index observed exposure, all sources, trend | +0.087 | 0.075 | 0.25 | 849 |
Anthropic Economic Index observed exposure, all sources, trend, weighted by baseline postings | +0.181 | 0.141 | 0.20 | 849 |
Anthropic Economic Index observed exposure, all sources, year-over-year (occ × tier × calendar-month FE) | +0.114 | 0.086 | 0.19 | 849 |
Felten AIOE (per s.d.), all sources, trend | +0.016 | 0.011 | 0.16 | 756 |
Felten AIOE (per s.d.), all sources, trend, weighted by baseline postings | -0.049 | 0.031 | 0.11 | 756 |
Felten AIOE (per s.d.), all sources, year-over-year (occ × tier × calendar-month FE) | +0.035*** | 0.013 | 0.01 | 756 |
Eloundou GPT-4 beta, LinkedIn only, trend | +0.167*** | 0.059 | 0.00 | 867 |
Eloundou GPT-4 beta, LinkedIn only, trend, weighted by baseline postings | +0.057 | 0.187 | 0.76 | 867 |
Eloundou GPT-4 beta, LinkedIn only, year-over-year (occ × tier × calendar-month FE) | +0.227*** | 0.069 | 0.00 | 867 |
Anthropic Economic Index observed exposure, LinkedIn only, trend | +0.121 | 0.087 | 0.16 | 825 |
Anthropic Economic Index observed exposure, LinkedIn only, trend, weighted by baseline postings | +0.379* | 0.204 | 0.06 | 825 |
Anthropic Economic Index observed exposure, LinkedIn only, year-over-year (occ × tier × calendar-month FE) | +0.146 | 0.104 | 0.16 | 825 |
Felten AIOE (per s.d.), LinkedIn only, trend | +0.057*** | 0.015 | 0.00 | 732 |
Felten AIOE (per s.d.), LinkedIn only, trend, weighted by baseline postings | -0.056 | 0.051 | 0.28 | 732 |
Felten AIOE (per s.d.), LinkedIn only, year-over-year (occ × tier × calendar-month FE) | +0.078*** | 0.017 | 0.00 | 732 |
Eloundou GPT-4 beta, non-LinkedIn, trend | +0.008 | 0.058 | 0.89 | 894 |
Eloundou GPT-4 beta, non-LinkedIn, trend, weighted by baseline postings | -0.030 | 0.117 | 0.80 | 894 |
Eloundou GPT-4 beta, non-LinkedIn, year-over-year (occ × tier × calendar-month FE) | +0.074 | 0.067 | 0.27 | 894 |
Anthropic Economic Index observed exposure, non-LinkedIn, trend | +0.053 | 0.098 | 0.58 | 849 |
Anthropic Economic Index observed exposure, non-LinkedIn, trend, weighted by baseline postings | -0.017 | 0.144 | 0.91 | 849 |
Anthropic Economic Index observed exposure, non-LinkedIn, year-over-year (occ × tier × calendar-month FE) | +0.082 | 0.116 | 0.48 | 849 |
Felten AIOE (per s.d.), non-LinkedIn, trend | -0.024* | 0.013 | 0.07 | 756 |
Felten AIOE (per s.d.), non-LinkedIn, trend, weighted by baseline postings | -0.043 | 0.031 | 0.16 | 756 |
Felten AIOE (per s.d.), non-LinkedIn, year-over-year (occ × tier × calendar-month FE) | -0.007 | 0.015 | 0.64 | 756 |
Click a column heading to sort.
The pay-band β is positive in every source and specification, significant in LinkedIn-sourced postings and in the year-over-year version, and not significant once occupations are weighted by size. Two post-period dummies agree: exposure × junior × post-March-2025 is +0.08 (s.e. 0.05), post-August-2025 is +0.18 (s.e. 0.05). A positive β means low-pay postings in exposed occupations grew relative to high-pay postings. Some of that is pay rather than people: Section 5.7 shows offered salaries in exposed occupations fell relative to other occupations, and a posting whose offered pay drops crosses from the high band into the low band without anyone hiring a junior. The sensitivity check makes the point: with the band thresholds held flat instead of grown at 3.5% a year, β rises to +0.26 (s.e. 0.05), which is what pay drift in exposed occupations would do. The title-tier result, which cannot be moved by pay, is the cleaner headcount test, and it is null.
Download
Download
5.2 Release dates: no breaks
For each major release, the same regression with month-relative-to-release dummies replacing the trend (window of six months either side, month −1 omitted). The fans are jagged in both directions, pre and post, because occupation-specific seasonality is not removed by the tier-month effect. No release shows a clean step. The pooled post coefficients run from -0.47 to +0.36, changing sign with the season in which the release fell.
Download
Download
Download
5.3 Levels: exposed occupations posted more
Download
Dropping the tier dimension and regressing log total postings on exposure × years with occupation-source and month-source effects gives β = +0.32 (s.e. 0.05, p < 0.001) pooled, +0.22 (s.e. 0.06) on LinkedIn-sourced postings and +0.42 (s.e. 0.06) on other sources, across 917 occupations. Exposed occupations gained postings relative to unexposed ones over the window, in LinkedIn-sourced and other postings alike. This is the expansion check in the research design (H5): cheaper cognition can expand demand for the occupations that use it. It is also consistent with a cyclical rebound in white-collar hiring from the 2023 to 2024 trough, which the data cannot separate without a pre-2024 baseline.
5.4 Firms
Each firm's exposure is the posting-weighted mean Eloundou score of its own US postings (15,289 firms with at least 50 postings). Regressing the low-pay share of a firm's monthly postings on exposure × years with firm and month effects gives β = -0.045 (s.e. 0.008, p < 0.001; 238,825 firm-months, 15,092 firms): a firm at exposure 0.8 versus one at 0.4 moved its posting mix away from low-pay roles about 1.8 percentage points a year faster. With title tiers the coefficient is -0.003 (s.e. 0.005). The two results are not in conflict with 5.1: occupation-level composition is stable while within-firm composition shifts, which is what you would expect if exposed firms are re-weighting toward higher-pay roles across occupations rather than cutting junior rungs within them.
Revelio's workforce-dynamics table (firm × month × seniority 1 to 7) would carry a direct employment test. The extract on disk covers two months (April and May 2026), so it is a cross-section only; the Part II note below asks for the full series.
5.5 Layoffs
Layoff tranches from 1990 to 2026 join to the same firm exposure through the firm identifier (5,698 firms with any layoff since 2019). A linear probability model of any layoff event in a firm-month on exposure × post-ChatGPT (Dec 2022) and exposure × post-agents (Mar 2025), with firm and month effects: exposure × post-ChatGPT +0.056 (s.e. 0.005, p < 0.001), exposure × post-agents -0.018 (s.e. 0.006, p = 0.001); 512,550 firm-months. Exposed firms laid off more in 2023 to 2024 than their pre-2023 pattern implied, and that tilt partly reversed after March 2025. Exposure here is measured from 2024 to 2026 postings, and exposed firms are disproportionately tech and finance, so this is as much a story about the rate-driven 2023 wave as about AI.
Download
5.6 Thirty countries: no wage gradient
The same triple difference per country (within-year pay-tercile tiers), then the country coefficients against the country's mean predicted salary. If AI displaces juniors where humans are expensive first, β should fall as wages rise. It does not: the weighted slope of β on log wage level is +0.040. Of 30 countries, 5 have a negative point estimate, 3 significantly so (Italy, France, Mexico), and 9 are significantly positive. The US coefficient is +0.05 (s.e. 0.10).
Download
5.7 Wage offers
On LinkedIn-sourced postings with a stated salary range (about a quarter of them), the log of the mean stated salary in an occupation-tier-month cell, same triple difference: β = -0.093 (s.e. 0.038, p = 0.016) on the junior-versus-senior contrast and -0.049 (s.e. 0.022, p = 0.025) on the level. Junior wage offers in exposed occupations slipped relative to senior offers, and exposed occupations' offers slipped slightly overall. Selection into stating a salary is not random, which keeps this at low-to-medium confidence.
5.8 New roles
Revelio maps raw titles to a fixed taxonomy, so genuinely new titles cannot appear; growth within AI-labelled categories can. AI- or ML-titled roles (AI, machine learning, LLM, generative AI, prompt engineering, agentic, MLOps, NLP, forward deployed) went from 0.20% in July 2024 to 0.50% in May 2026 (78,841 postings in May 2026) of US postings. The largest categories are machine-learning engineering, AI leadership roles, AI and ML trainers, AI consulting, AI software development and AI product management.
Download
5.9 The friction gap
Rated exposure (what a model could do) and observed exposure (what Claude is actually used for, from the Anthropic Economic Index, occupation level, March 2026 release) correlate 0.63 across 876 occupations (Spearman 0.72). The gap is systematic by occupation group: observed usage runs far above the rating in computer and math, legal, sales, office and finance work, and far below it in engineering, transportation, protective service, production and healthcare delivery. The groups with the largest shortfall are the ones where errors are physical, licensed or supervised, which is the friction hypothesis (H3) in the design.
Download
5.10 Sorting by residual hard tasks (H4)
Splitting occupations by the share of their O*NET tasks rated not exposed (E0) in the Eloundou task file: β = +0.01 (s.e. 0.10) in occupations with few unexposed tasks left and +0.25 (s.e. 0.14) in occupations with many; the interaction is -0.10 (s.e. 0.10). No evidence that occupations with few hard tasks left are losing juniors faster.
Part II. The pre-ChatGPT window: July 2019 to May 2026
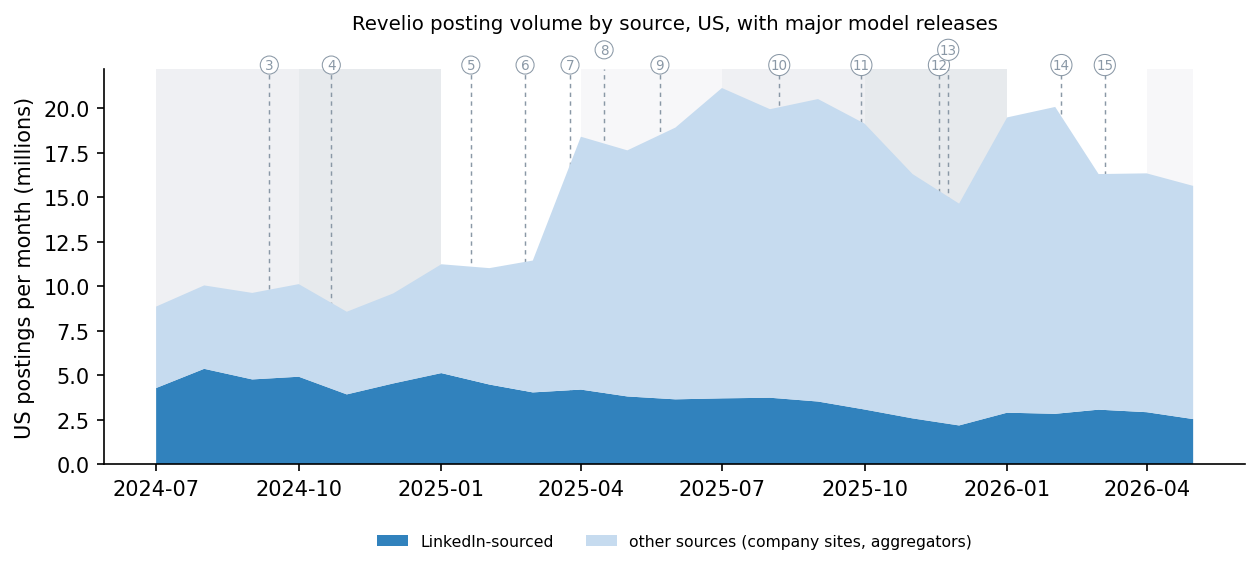
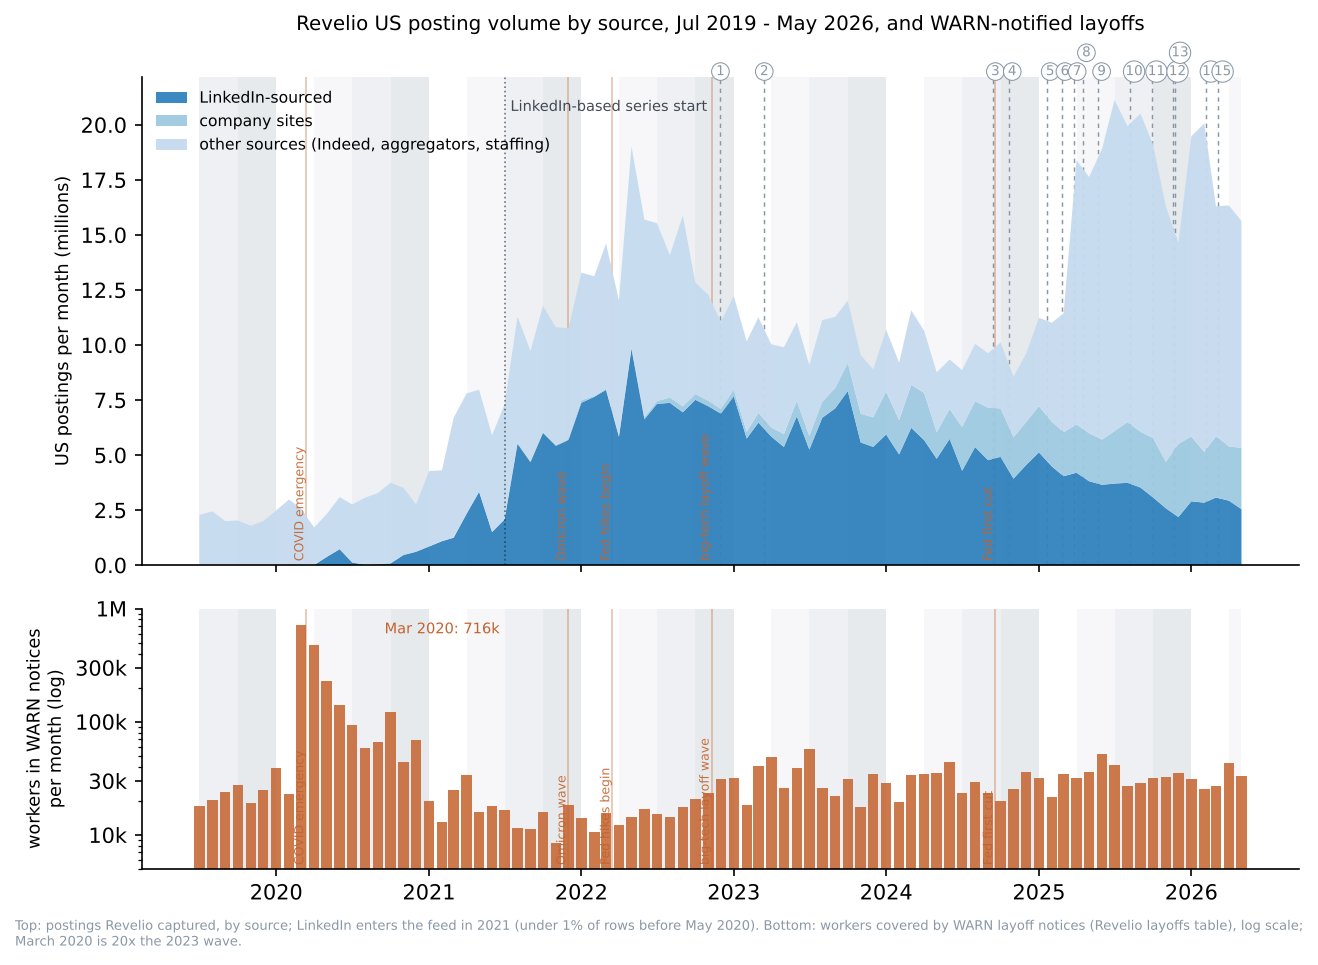
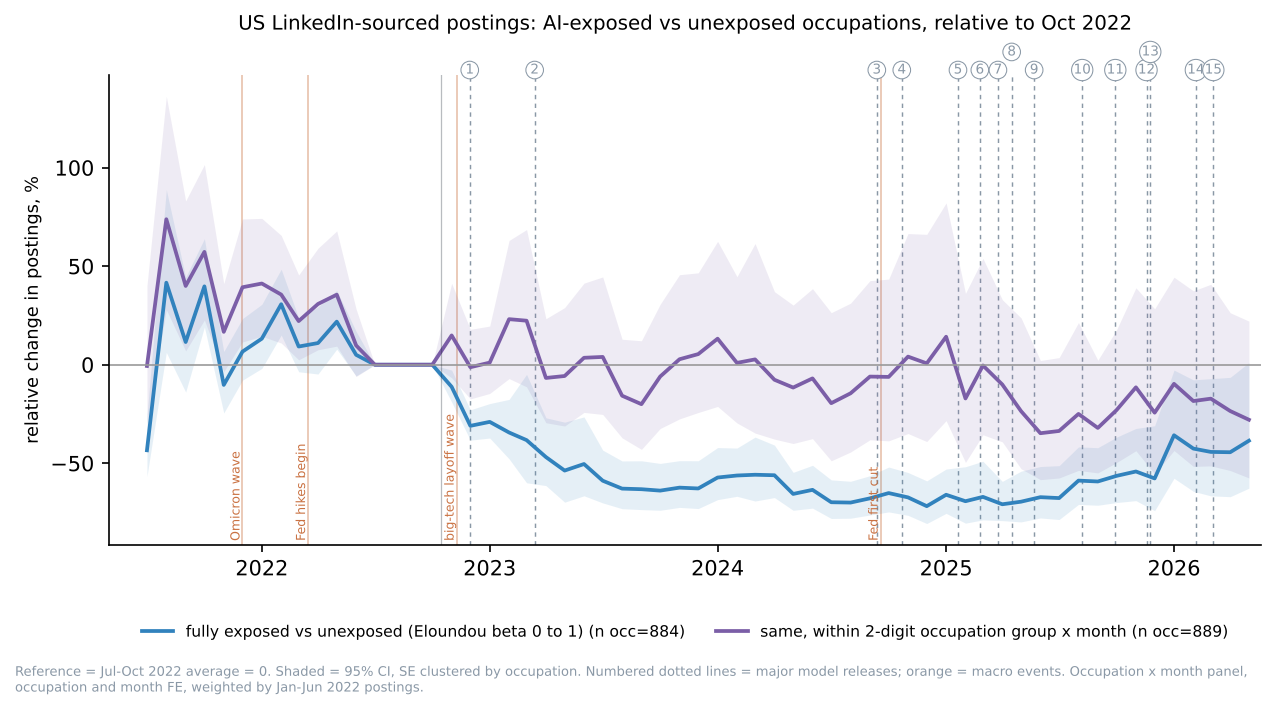
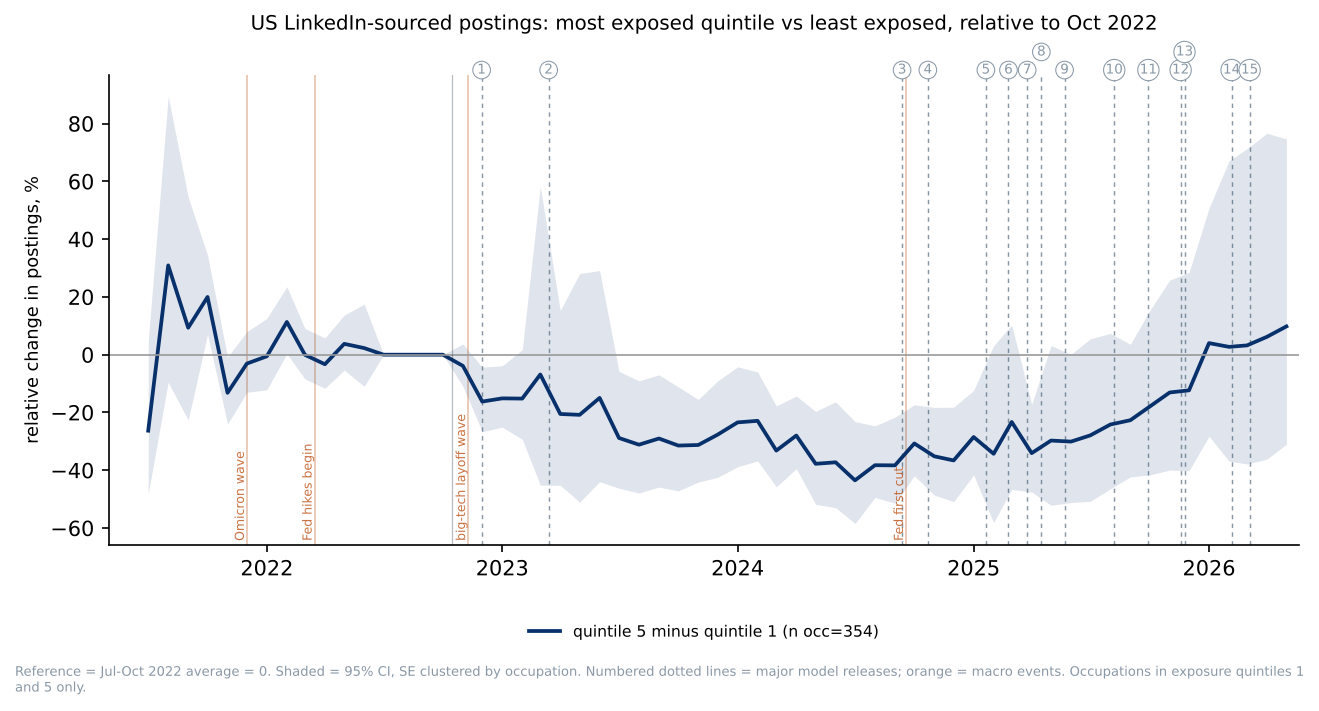
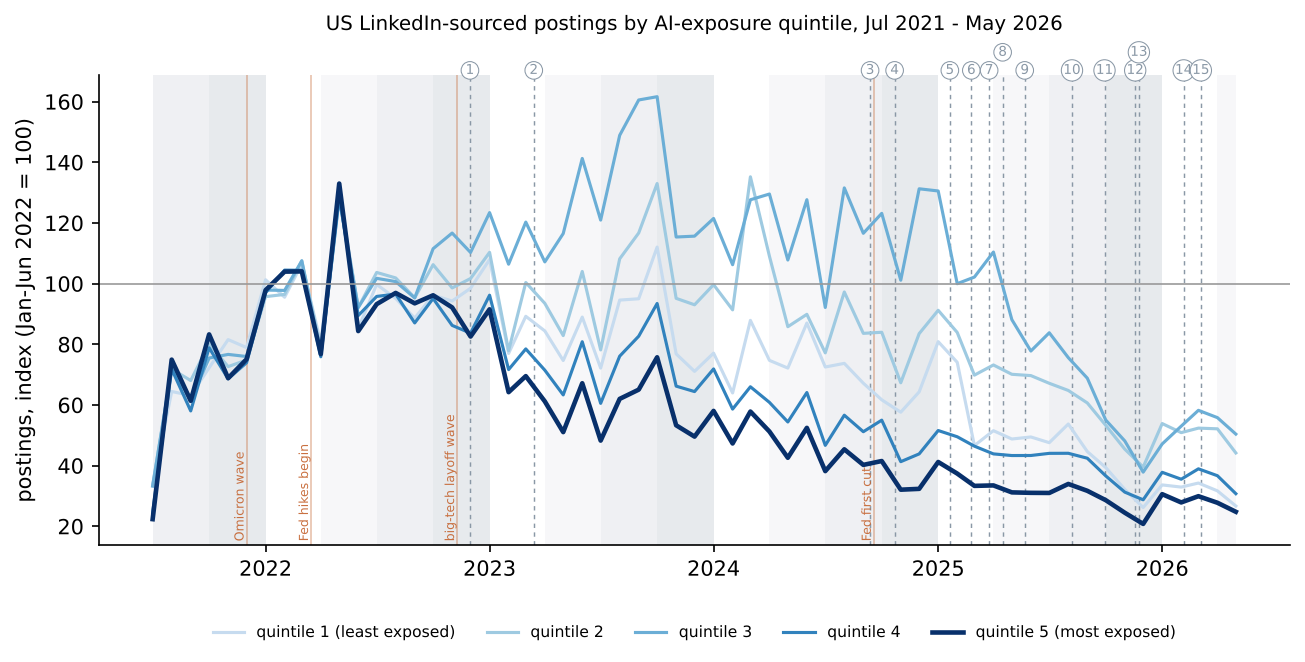
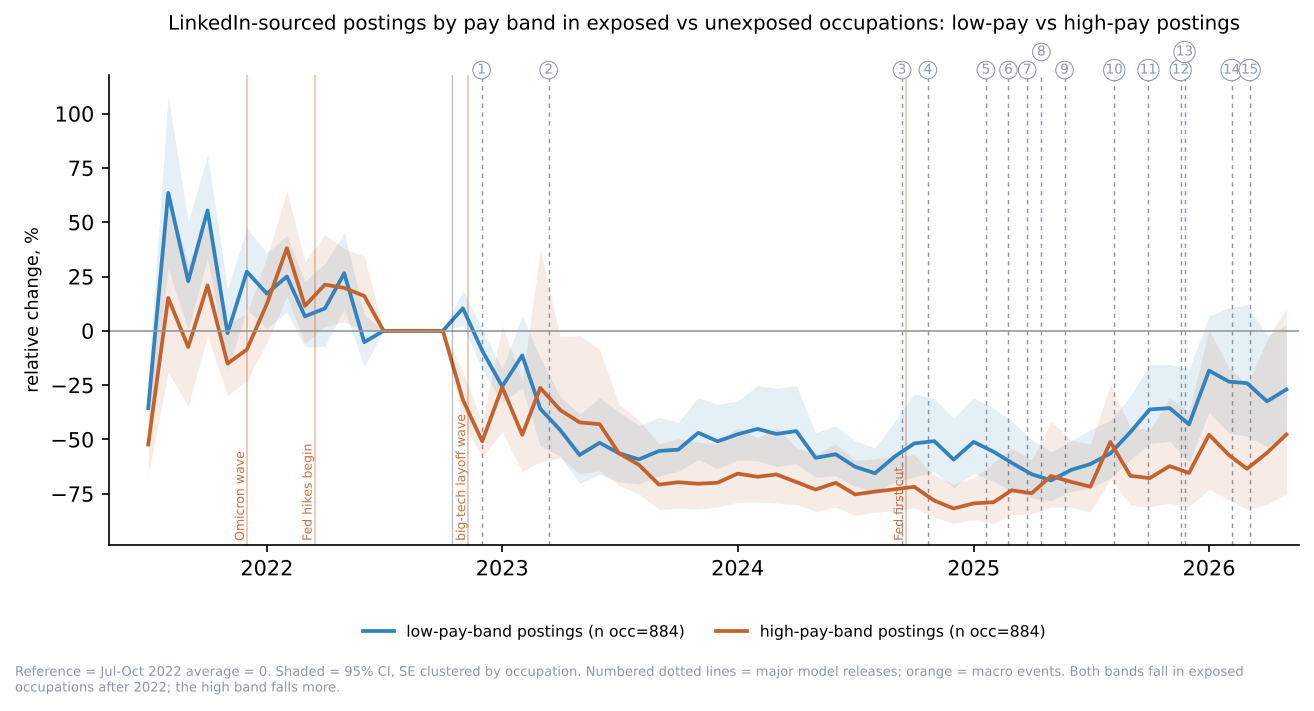
Part I had no baseline: postings began in June 2024, after ChatGPT, GPT-4 and the first coding assistants. Five further Revelio pulls (fiscal years July 2019 to June 2024, full schema) extend the panel to 2.53 billion postings and 83 months, 40 of them before ChatGPT. Not all of it is usable for every series. Revelio's LinkedIn feed is under 1% of its US postings before May 2020 and ramps up, white-collar occupations first, between November 2020 and July 2021, so a LinkedIn-only contrast between exposed and unexposed occupations in those months measures LinkedIn's coverage, not hiring. LinkedIn-sourced series therefore start in July 2021 (16 months before ChatGPT), the first month from which LinkedIn's count stays above a quarter of its Jan to Jun 2022 level. Non-LinkedIn sources (Indeed and other aggregators before 2021; company sites and staffing firms join later) run from July 2019 and carry the COVID shock, which is used as a placebo: a large demand shock to the same occupations that had nothing to do with AI. The design changes accordingly: every outcome is now a monthly event study, occupation by month, with the average of July to October 2022 (the last four months before ChatGPT) as the reference, occupation and month fixed effects, Jan to Jun 2022 posting weights, and standard errors clustered by occupation. The coefficient in each month is the difference between a fully exposed and a fully unexposed occupation (Eloundou GPT-4 beta 0 to 1) relative to that difference in the reference months. Grey dotted lines are the major model releases; orange lines are the Fed hiking cycle and the big-tech layoff wave.
Download
| Controlling for | Result | Interpretation | Confidence |
|---|---|---|---|
Each occupation's own level and each month's level; LinkedIn-sourced postings only (the source whose capture is steadiest over 2021 to 2026) | Exposed occupations' LinkedIn-sourced postings fell 61% relative to unexposed ones over the post-ChatGPT period (fully exposed vs fully unexposed; s.e. 14 pts, p <0.01); the trough was 72% in Dec 2024, and by Dec 2025 to May 2026 the gap had closed to 44%. | Hiring intent in AI-exposed occupations did fall sharply in 2023 and stayed down for two years. The timing (first negative month: December 2022) is consistent with a ChatGPT effect, and equally with the 2023 white-collar hiring freeze. | medium |
Same, read before November 2022 | The relative decline did not start with ChatGPT: exposed occupations were +31% above their Oct 2022 position in Feb 2022 and slid to zero through the Fed hiking year; the linear pre-trend over Jul 2021 to Oct 2022 is +0.02 (s.e. 0.10) because the hump nets out, not because the pre-period is flat. | The pre-period is not parallel. Exposed occupations were already converging down from a 2021 to early-2022 hiring boom (tech, finance). A design that dates the break at ChatGPT attributes part of a rate-cycle correction to AI. | high (descriptive) |
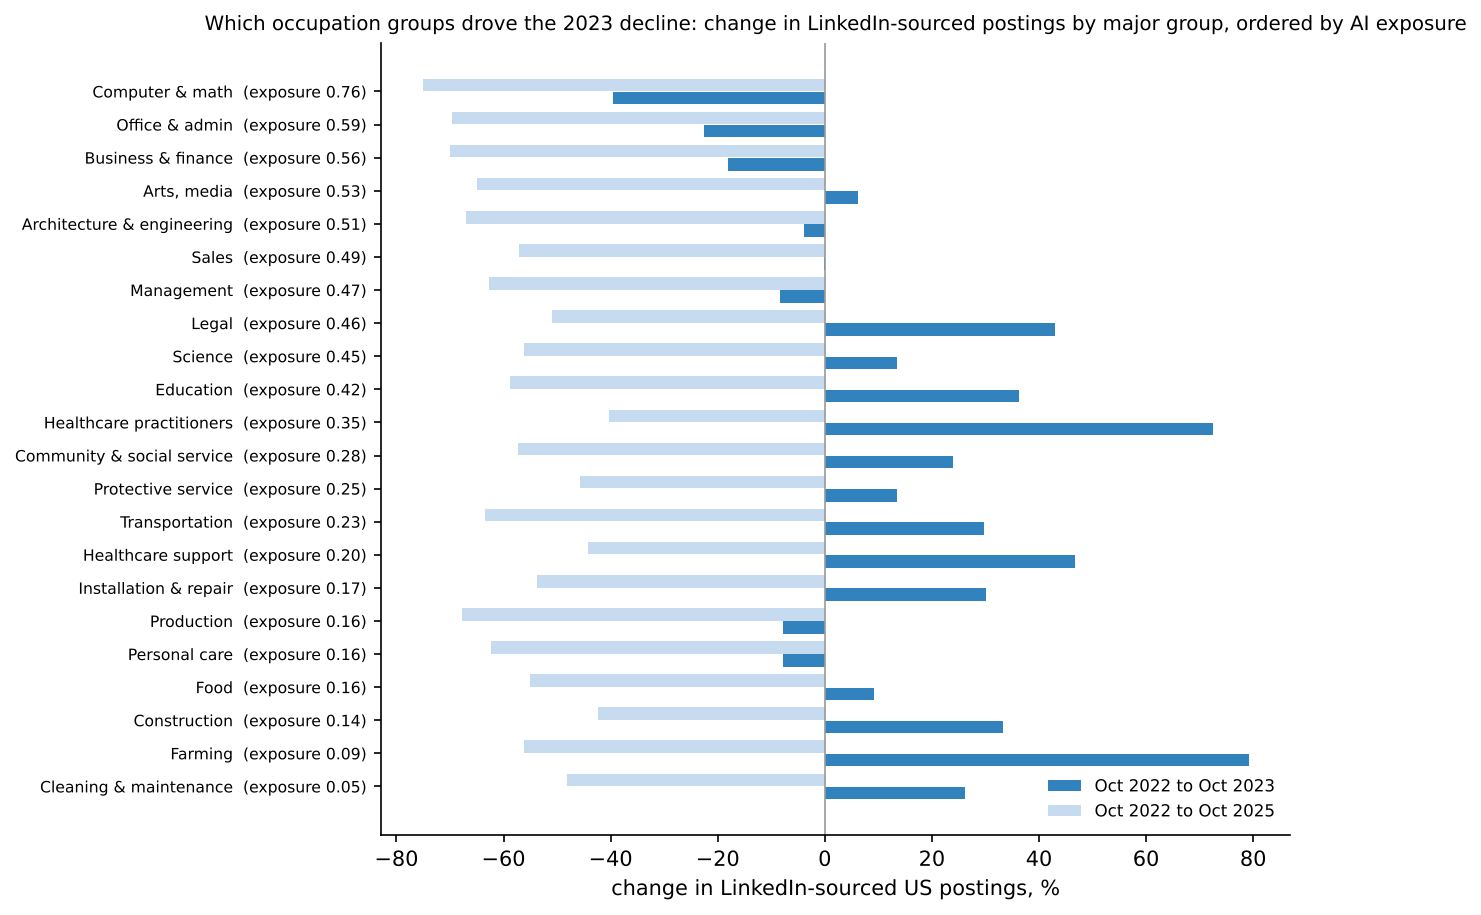
Nothing (decomposition by 2-digit occupation group) | Computer and mathematical occupations (exposure 0.76) lost 40% of LinkedIn-sourced postings between Oct 2022 and Oct 2023; the median other major group moved +13%. By Oct 2025 every group was down 57% or so (coverage), so the 2023 gap is a computer-occupations story. | The exposed-occupation decline of 2023 is the software hiring bust. Legal, business, office and media occupations, all highly rated for exposure, did not fall out of line with the rest in 2023. | high (descriptive) |
Everything that hits a 2-digit occupation group in a given month (the tech cycle, rate shocks, group-specific coverage), plus each occupation's level | Within 2-digit occupation groups (occupation + group x month fixed effects), the post-ChatGPT coefficient is -26% (s.e. 16 pts, p = 0.05) with a pre-trend of -0.28/yr (s.e. 0.12). | Within groups, more exposed occupations lost ground to less exposed ones after ChatGPT, by roughly a quarter, with an interval that reaches zero and a pre-trend of the same sign. This is the AI-specific residual once the tech cycle is held fixed: suggestive, not established. | low to medium |
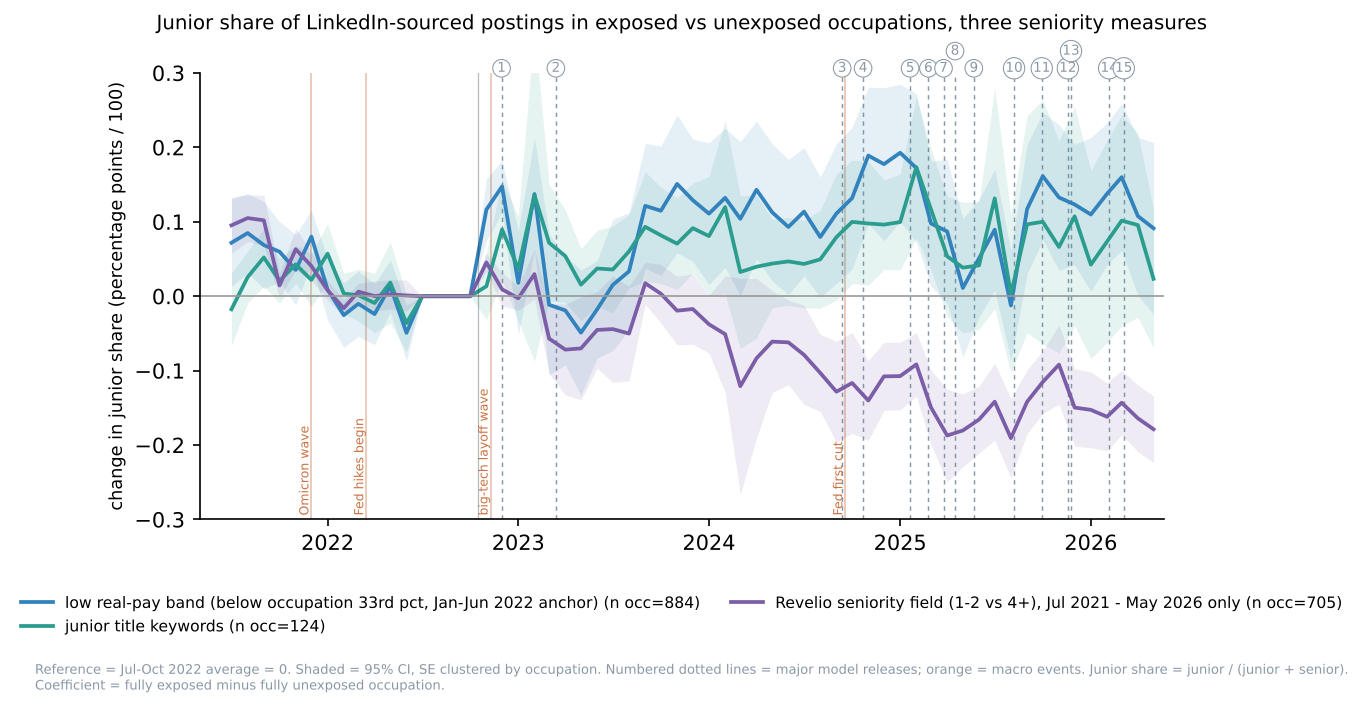
Occupation and month, within LinkedIn-sourced postings; three independent seniority measures | Junior share, post-ChatGPT, fully exposed vs unexposed: pay bands +7.2 pts (s.e. 3.4), title keywords +6.2 pts (s.e. 3.4), Revelio's own seniority field (post-GPT-4, series through May 2026) -12.4 pts (s.e. 2.1); the seniority field after the agentic wave (Mar 2025 on): -12.8 pts (s.e. 1.9, p <0.01); within 2-digit groups the pay-band estimate is +1.9 pts (s.e. 4.8). | Two of the three measures show no broken rung in the composition of hiring: the pay-band measure rises because offered pay fell (postings move into the low band), and titled postings tilt toward junior keywords. Revelio's seniority field, now running through May 2026, is the exception. Its path is flat through 2022 once the 2021 convergence is over, dips in the March to August 2023 reclassification (visible in every quintile) and returns, then falls from early 2024 to about -16 pts in the last six months; within 2-digit occupation groups the post-agentic estimate is -7.8 pts (s.e. 3.2). It is a within-occupation shift in computer and IT work: on this field the junior share went, from the first half of 2022 to 2026, Software Developers 74% to 60%; Computer Systems Engineers/Architects 37% to 22%; IT Project Managers 22% to 8%; Business Intelligence Analysts 64% to 54%. The exposed non-technical occupations (customer service, sales) and all of the least exposed occupations sit at 99 to 100% junior on this field and cannot move, so the control group is a ceiling and the estimate is mostly the exposed occupations' own change. Pooled quintile shares barely move, because postings shifted toward the high-junior-share exposed occupations at the same time. The title-keyword measure moves the other way inside the same postings (Software Developers' junior-keyword share 7% to 14%), so two readings of the same postings disagree. The seniority model reads the description; experience requirements rising inside unchanged titles would produce exactly this pattern, and so would classifier drift. It is the first measure in the paper to show a broken-rung-shaped move in the agentic period, and the one most in need of an outside check. | medium |
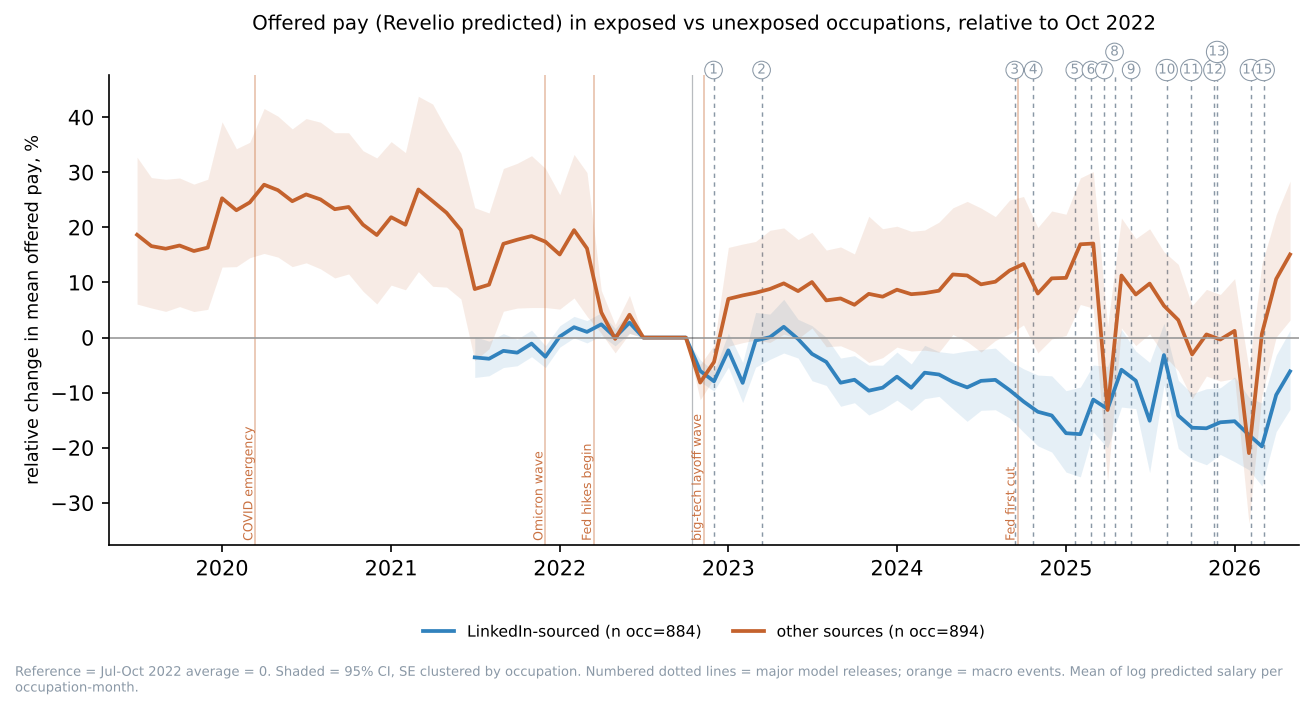
Occupation and month; LinkedIn-sourced; Revelio predicted salary | Offered pay in exposed occupations fell 9% relative after ChatGPT (s.e. 2 pts, p <0.01) and 8% over the agentic period; within 2-digit groups -5% (s.e. 3 pts, p = 0.09). | The one effect that survives every specification, including within-group, is price: exposed occupations have been offering relatively less since 2023. As in Part I, AI pressure, if that is what this is, shows in the pay of a posting before the count of junior postings. | medium |
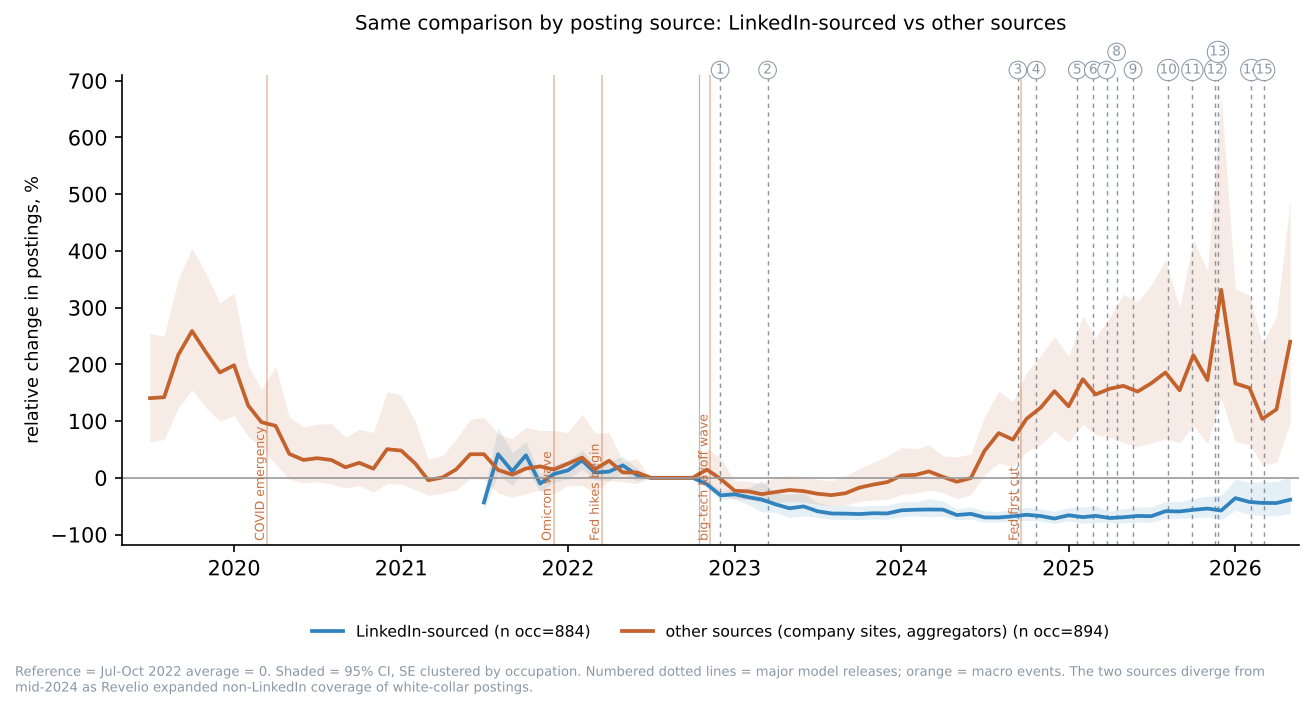
Same design, non-LinkedIn sources | In non-LinkedIn sources the same comparison runs the other way: exposed occupations' postings rose +142% relative over the agentic period (s.e. 18 pts), the signature of Revelio adding white-collar coverage from company sites and aggregators in 2024 to 2025. | All-source totals cannot be used for 2024 to 2026 trends. Any study that pools Revelio sources across this window will find exposed-occupation hiring booming in 2025, and it is coverage. | high |
Occupation and month; non-LinkedIn sources; the COVID shock in place of ChatGPT | COVID placebo (non-LinkedIn sources, which exist from Jul 2019; pre = Jul 2019 to Feb 2020, post = Mar 2020 to Feb 2021): exposed occupations' postings fell 50% relative to unexposed (s.e. 16 pts, p <0.01); junior share by pay bands -10.7 pts (s.e. 3.2), by title keywords -0.3 pts (s.e. 2.7), by Revelio's seniority field +3.5 pts (s.e. 1.1); the same field's post-ChatGPT estimate in these sources is -6.9 pts (s.e. 1.3); offered pay +4% (s.e. 2 pts). | Read with the event-study path (Figure II.5): in the non-LinkedIn feed the exposed-occupation gradient was about +100% in 2019, +40% through 2020, +17% in late 2021 and zero at the reference, so the placebo mixes a COVID step with a multi-year coverage drift. Either way, this feed's exposure gradient moves by ChatGPT-sized amounts for reasons that have nothing to do with AI, which is the scale against which the 2023 decline has to be read. The within-occupation share measures are cleaner: the pay-band junior share dipped during COVID and recovered by 2021 (a shock pattern, driven by offered pay, which rose in exposed occupations), and Revelio's seniority field bumped toward juniors and returned. Neither resembles the post-ChatGPT path, where the seniority field moves away from juniors and stays there. Source composition inside the non-LinkedIn feed is not observed before 2021, so the placebo is read for direction and size, not to the decimal. | medium |
Click a column heading to sort.
II.1 Volume
Download
Download
Download
Download
Download
II.2 Seniority
Download
Download
II.3 Pay
Download
II.4 Robustness
Difference-in-differences coefficients (exposure x post-period, pre-period from July 2021), with the pre-trend (exposure x years, July 2021 to October 2022, same fixed effects) alongside. "All sources" pools LinkedIn and non-LinkedIn postings and is shown to document the coverage problem, not as evidence. The last column is the COVID placebo on the all-source panel (pre Jul 2019 to Feb 2020, post Mar 2020 to Feb 2021), which before July 2021 is the non-LinkedIn feed alone, LinkedIn months before then being masked.
| Sample | Fixed effects | Outcome | Pre-trend /yr (s.e.) | Post-ChatGPT (s.e.) | Post-GPT-4 (s.e.) | Post-agents, Mar 2025 (s.e.) | COVID placebo (s.e.) |
|---|---|---|---|---|---|---|---|
LinkedIn-sourced | occupation + month FE | ln_total | +0.019 (0.095) | -0.931*** (0.141) | -0.894*** (0.139) | -0.316** (0.156) | n/a |
LinkedIn-sourced | occupation + month FE | junior_share | -0.078 (0.023) | +0.072** (0.034) | +0.066** (0.031) | +0.028 (0.033) | n/a |
LinkedIn-sourced | occupation + month FE | mean_lnpay | +0.036 (0.013) | -0.091*** (0.023) | -0.088*** (0.023) | -0.082*** (0.027) | n/a |
LinkedIn-sourced | occupation + SOC2 x month FE | ln_total | -0.279 (0.121) | -0.307* (0.158) | -0.309** (0.155) | -0.307* (0.157) | n/a |
LinkedIn-sourced | occupation + SOC2 x month FE | junior_share | -0.032 (0.040) | +0.019 (0.048) | +0.031 (0.042) | -0.014 (0.035) | n/a |
LinkedIn-sourced | occupation + SOC2 x month FE | mean_lnpay | +0.026 (0.022) | -0.052* (0.030) | -0.061** (0.030) | -0.044* (0.026) | n/a |
all sources | occupation + month FE | ln_total | +0.071 (0.213) | -0.398*** (0.128) | -0.366*** (0.128) | +0.054 (0.128) | -0.662*** (0.118) |
all sources | occupation + month FE | junior_share | +0.075 (0.026) | +0.034 (0.028) | +0.016 (0.027) | -0.021 (0.026) | -0.111*** (0.027) |
all sources | occupation + month FE | mean_lnpay | -0.066 (0.040) | -0.095*** (0.023) | -0.093*** (0.025) | -0.166*** (0.033) | +0.052*** (0.020) |
all sources | occupation + SOC2 x month FE | ln_total | -0.856 (0.471) | +0.406* (0.209) | +0.453** (0.228) | +0.541** (0.215) | -0.473*** (0.181) |
all sources | occupation + SOC2 x month FE | junior_share | +0.179 (0.050) | -0.085 (0.056) | -0.109* (0.057) | -0.160*** (0.048) | -0.070** (0.035) |
all sources | occupation + SOC2 x month FE | mean_lnpay | -0.211 (0.071) | +0.024 (0.049) | +0.036 (0.056) | -0.033 (0.050) | +0.078*** (0.028) |
LinkedIn-sourced, Revelio seniority field | occupation + month FE | junior_share | -0.085 (0.015) | -0.129*** (0.023) | -0.132*** (0.022) | -0.130*** (0.020) | n/a |
LinkedIn-sourced, Revelio seniority field | occupation + SOC2 x month FE | junior_share | -0.016 (0.022) | -0.060** (0.026) | -0.058** (0.026) | -0.078** (0.032) | n/a |
LinkedIn-sourced, title keywords | occupation + month FE | junior_share | +0.013 (0.019) | +0.033*** (0.011) | +0.017 (0.014) | +0.023 (0.015) | n/a |
LinkedIn-sourced, title keywords | occupation + SOC2 x month FE | junior_share | +0.006 (0.029) | +0.008 (0.020) | +0.001 (0.023) | -0.003 (0.028) | n/a |
Click a column heading to sort.
Notes. Stars: *** p<0.01, ** p<0.05, * p<0.1.
Part III. Headcount: Revelio workforce dynamics, Sep 2020 to Sep 2026
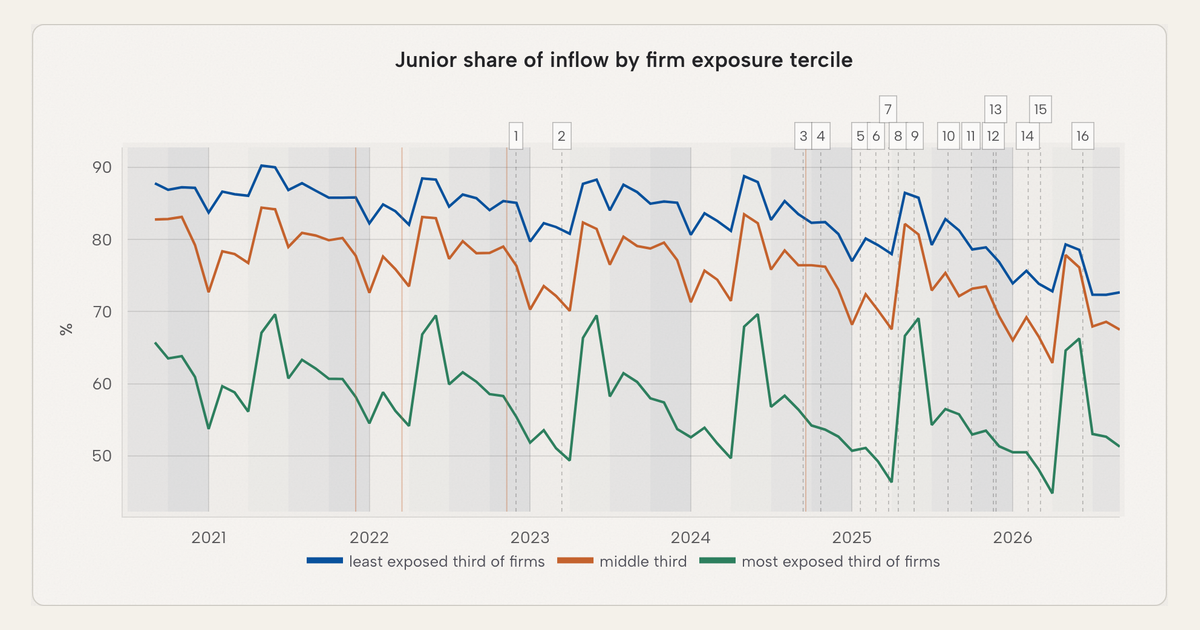
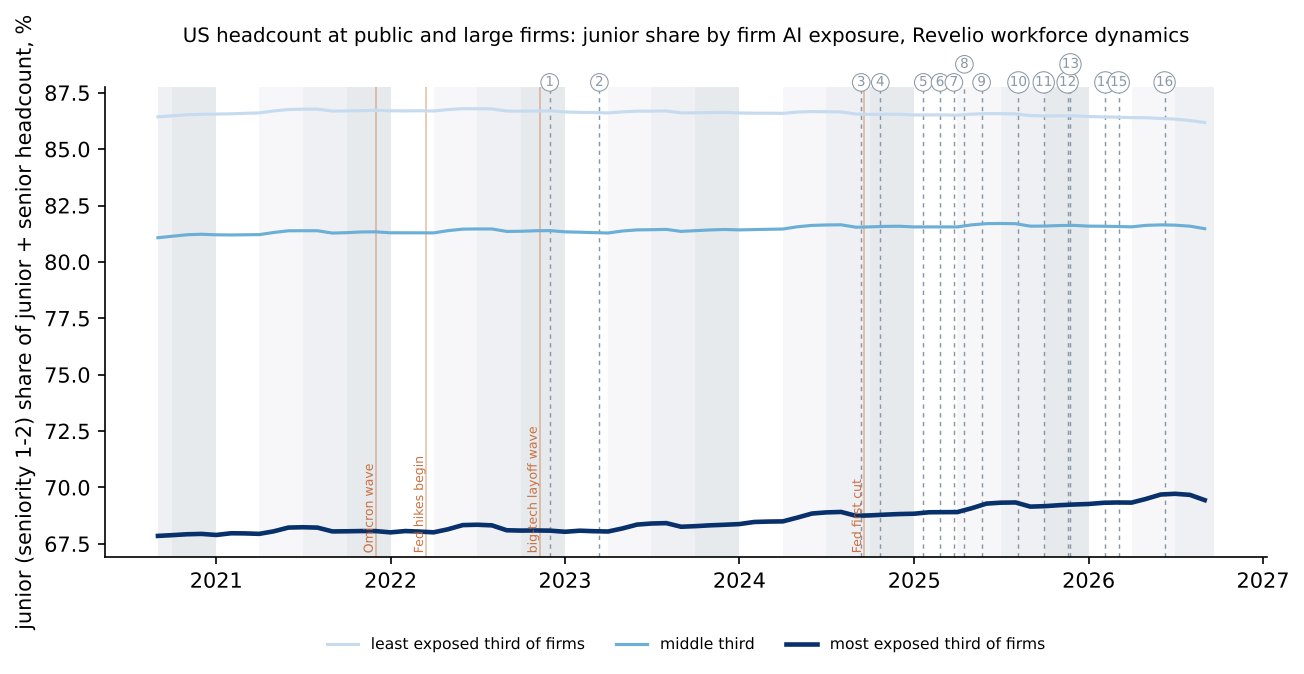
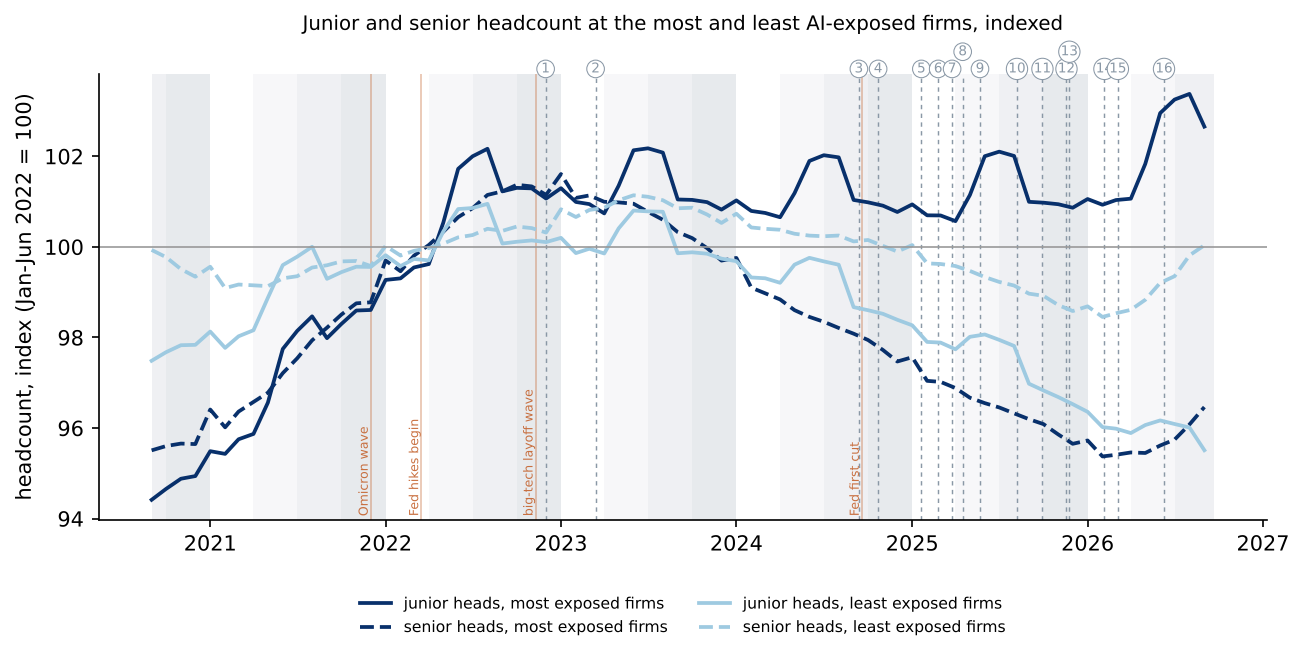
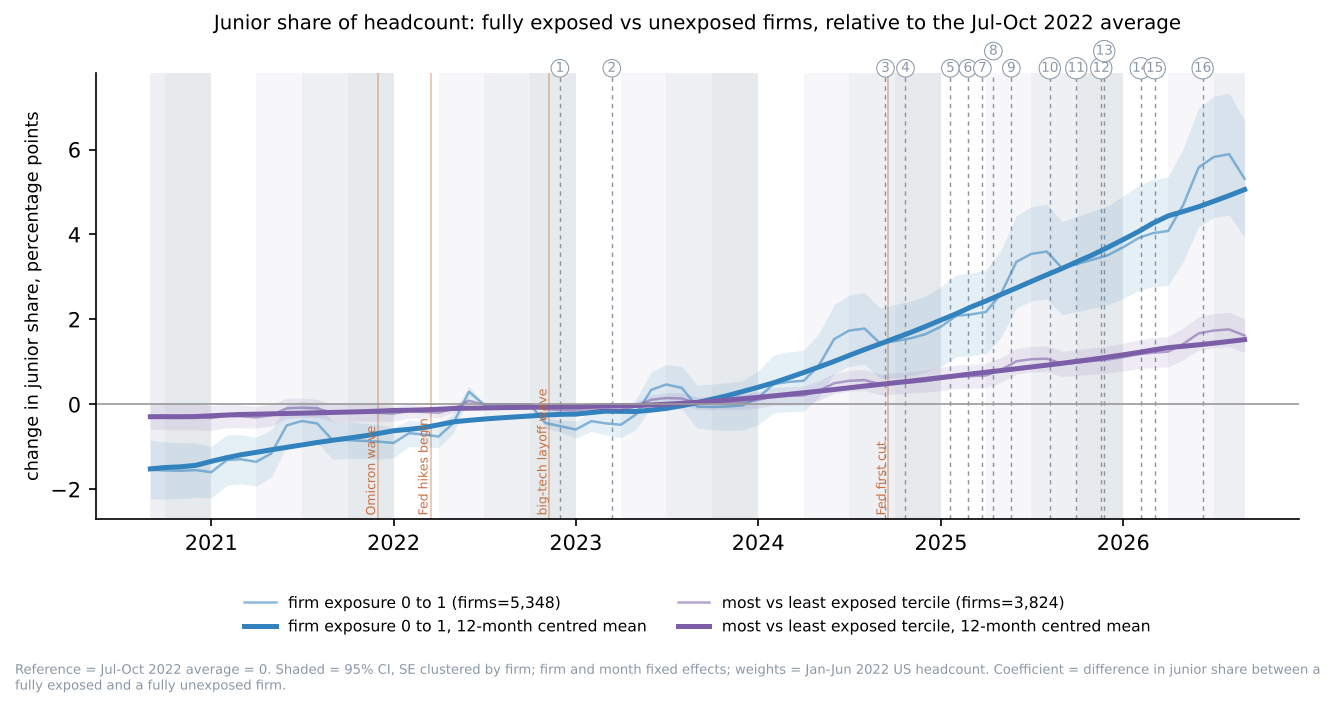
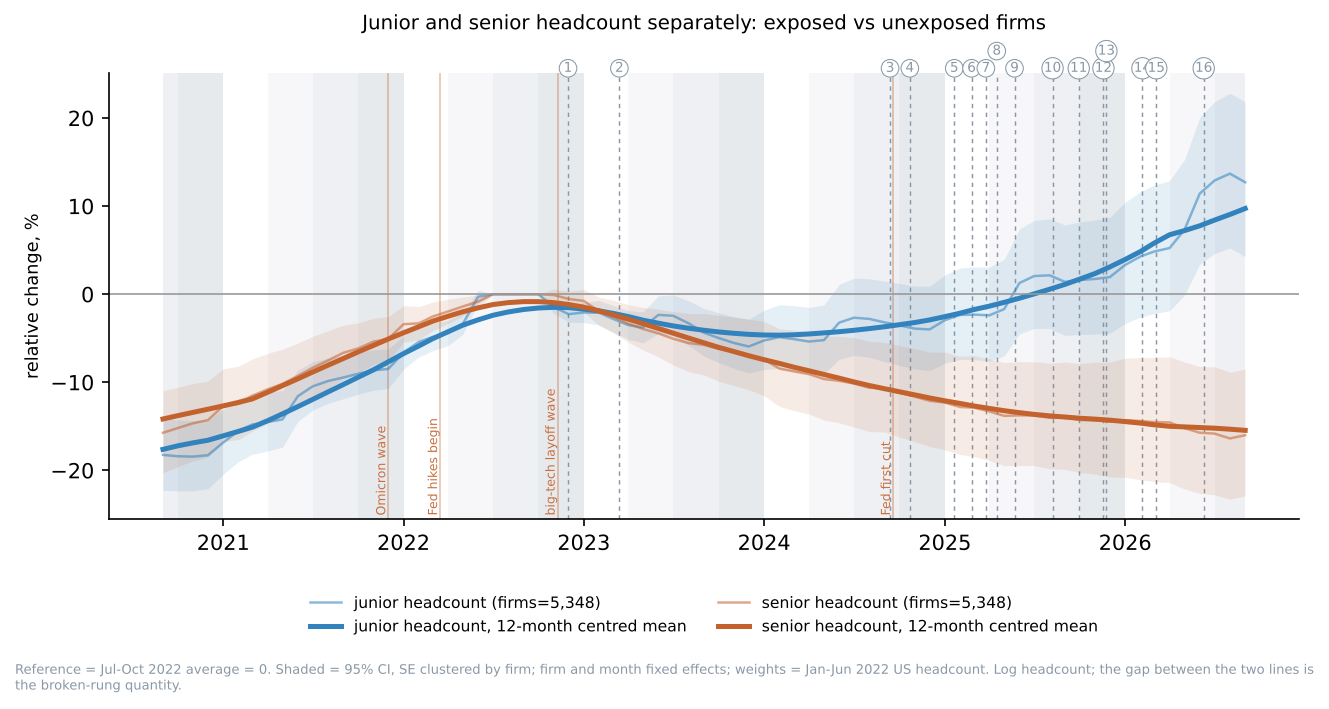
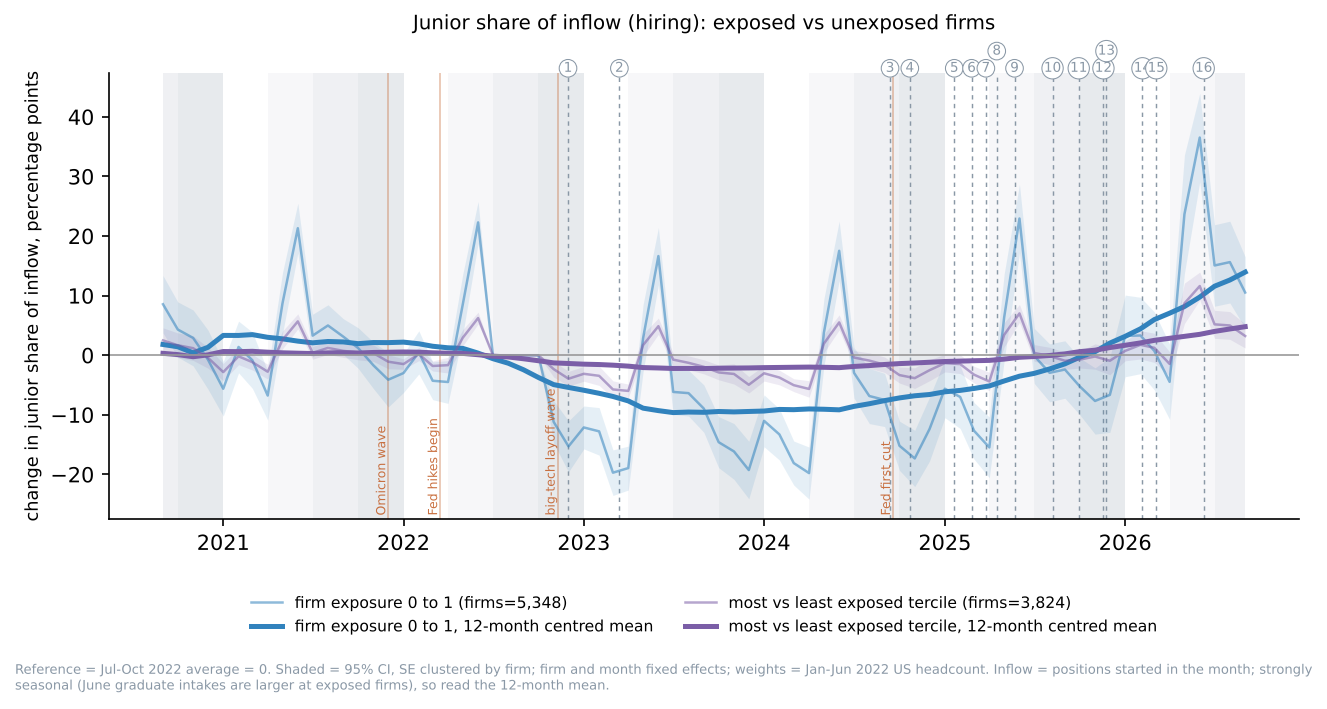
Parts I and II measured hiring intent. Part III measures people: Revelio's workforce-dynamics table gives, for every firm and month, headcount and inflow by seniority level (1 = entry to 7 = executive), built from professional profiles. Junior is seniority 1 to 2, senior 4 to 7. Firm AI exposure is the posting-weighted Eloundou rating of the firm's own US postings before ChatGPT (pre-ChatGPT postings (2019-07 to 2022-10), >= 30 matched US postings). The design is the same as Part II, at firm level: event studies relative to the Jul to Oct 2022 average with firm and month fixed effects, Jan to Jun 2022 headcount weights, standard errors clustered by firm; then a triple difference with firm x band, firm x month and band x month fixed effects; then the same within Revelio's role families so that a firm's mix of roles cannot drive the result. Descriptively, the junior share of headcount at the most exposed third of firms went from 67.9% in Sep 2020 to 69.4% in Sep 2026; at the least exposed third from 86.4% to 86.2%.
| Controlling for | Result | Interpretation | Confidence |
|---|---|---|---|
Each firm's own baseline and each month; firms with >= 20 US heads in Jan-Jun 2022; firm exposure from the firm's own pre-ChatGPT posting mix | Junior share of headcount, fully exposed vs unexposed firm, after ChatGPT: +2.7 pts (s.e. 0.5, p <0.01); after the agentic wave (Mar 2025): +4.0 pts (s.e. 0.5); pre-trend +0.78 pts/yr (s.e. 0.18). 5,348 firms. | Exposed firms' workforces tilted toward juniors after ChatGPT, the opposite of the broken-rung prediction. | high |
Same, junior and senior headcount separately | Junior headcount +10% (s.e. 3 log pts, p <0.01); senior headcount -4% (s.e. 4, p = 0.26), exposed vs unexposed firm after ChatGPT. | Seniors fell further than juniors at exposed firms. | high |
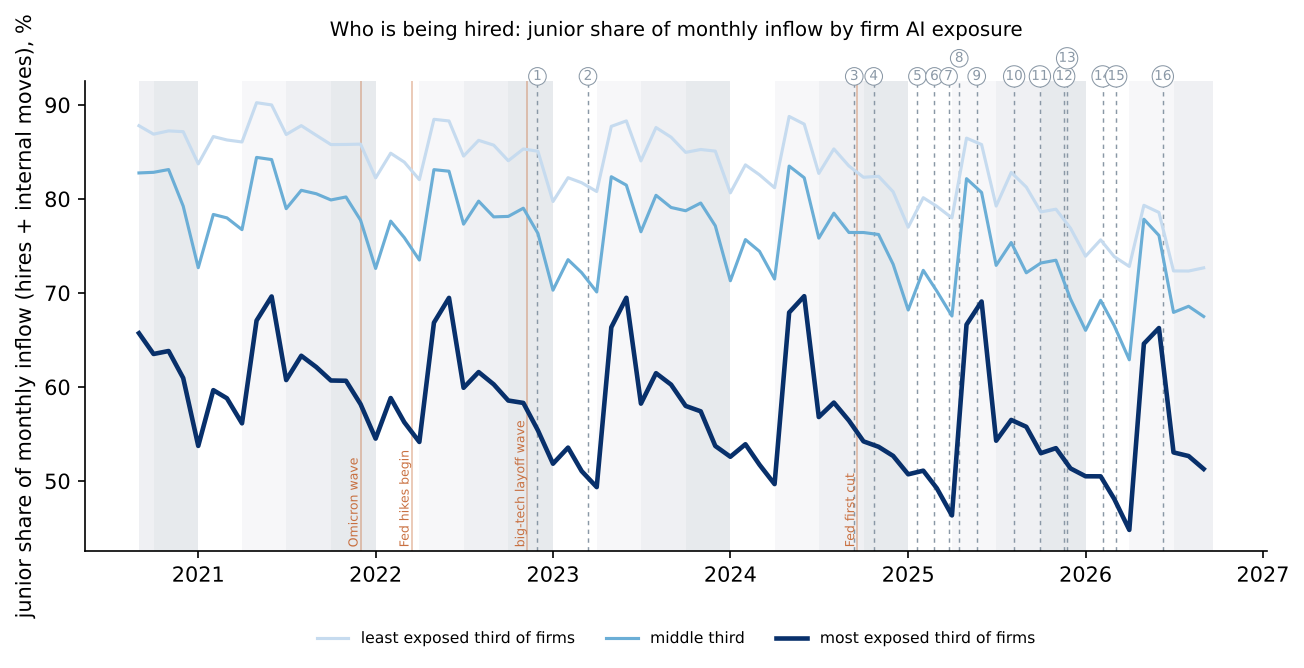
Same, the flow of new positions rather than the stock | Junior share of monthly inflow (positions started), exposed vs unexposed firm: after ChatGPT -5.4 pts (s.e. 1.6, p <0.01); after GPT-4 -2.2 pts (s.e. 1.6, p = 0.18); after the agentic wave +7.9 pts (s.e. 1.8, p <0.01). The 12-month mean of the monthly coefficients runs about -9 pts through 2023 and the first half of 2024, returns to zero by late 2025 and is positive in 2026. | Hiring, the flow, is where a broken rung would show first, and this is the one place it does: for roughly eighteen months after ChatGPT, exposed firms filled a smaller share of their new positions with juniors than unexposed firms did. The dip coincides with the 2023 white-collar hiring freeze, and it reversed as hiring resumed. A temporary tilt against junior hiring, not a structural one. | high |
Same, read before November 2022 | Pre-trends in levels: junior headcount +11% per year (s.e. 1) and senior headcount +9% per year (s.e. 2) at exposed vs unexposed firms, Sep 2020 to Oct 2022; junior share +0.8 pts per year (s.e. 0.2). | Exposed firms were growing faster than unexposed firms before ChatGPT (the 2021 tech boom), in both bands. Level results inherit that trend; the share and the triple difference, which compare juniors with seniors inside the same firm and month, do not. | high (descriptive) |
Everything that hits a firm in a month, everything that hits all juniors in a month, and each firm's permanent mix; then the same within each of Revelio's 12 role families | Triple difference (firm x band, firm x month, band x month fixed effects): exposure x junior x post-ChatGPT = +0.131 (s.e. 0.040, p <0.01), i.e. +14% in junior relative to senior heads at a fully exposed firm; within role (firm x role x band, firm x role x month): +0.107 (s.e. 0.030, p <0.01), firms with >= 100 heads. | This is the cleanest headcount test in the paper. The sign is against the hypothesis. | high |
Click a column heading to sort.
Download
Download
Download
Download
Download
Download
6. What this does not show
- Power. The pay-band β has a standard error of about 0.05 and the title-tier β about 0.28. The Canaries result translates to roughly −0.05 per year on this scale. The pay-band interval (-0.01 to +0.18) excludes it; the title-tier interval does not. The cleaner headcount test is the less powerful one.
- The pre-ChatGPT window is not a clean baseline. Part II has 16 months before ChatGPT in the LinkedIn-sourced series (40 in the other sources, which also carry the COVID shock), but exposed occupations were converging down from a 2021 hiring boom through the 2022 hiking cycle, and the big-tech layoff wave began three weeks before ChatGPT. Within-group estimates net out the tech cycle at the 2-digit level only. The pre-2024 pulls carry Revelio's seniority field; the 2024 to 2026 pulls do not, so the direct seniority test stops in June 2024 until those years are re-pulled with the full schema.
- Postings are intent, not hires. A firm can post a junior req and fill it with an agent, or post fewer reqs with larger expected hires. Expected-hires weighting is a planned robustness check.
- Pay bands are a proxy for rung, and they move with pay. They validate where ladders are steep (software, law) and not where they are flat (analysts, clerical), and a fall in offered pay moves postings into the low band with no change in who is hired. Title tiers are immune to that but cover 15% of postings, 145 occupations with full coverage, and are seasonal.
- Coverage drift. Revelio's capture changed within the window. Source-interacted fixed effects remove level shifts by occupation and month; they cannot remove a source change that is itself tilted by tier within an occupation.
- Exposure is static. Eloundou ratings are a 2023 snapshot; the AEI observed measure is from 2026. Neither dates when a task crossed the frontier. The design in the original proposal (an agent battery re-run across model generations) would supply crossing dates; it is Part II.
- Correlational extensions. Levels, layoffs, wage offers and cross-country results share the sector-cycle confound and are labelled accordingly.
7. What comes next
The first version listed five items. Two are done and folded in above: the pre-ChatGPT window with the seniority field through May 2026 (Part II), and the firm-level employment test on the workforce-dynamics table (Part III). Still open:
- Re-pull the nine source flags for July 2024 to June 2026 (a column pull joined on job_id, like the seniority supplement), to name which feed drove the 2024 to 2026 coverage expansion.
- Vacancy-duration outcomes from the remove-date field, which now runs July 2019 to June 2026 (the 2024 to 2026 postings carry it on 95 to 99% of rows, via the job_id supplement), with expected-hires weighting; time-varying exposure from successive Anthropic Economic Index releases.
- The outage design from the companion note (API outages as hourly withdrawal shocks on GitHub activity), which needs no permissions and is the cleanest causal idea in the agenda.
- The agent battery, as a calibration appendix across 10 to 15 occupations rather than the spine of the paper.
Reproducibility
Each figure also exists as an interactive Plotly version, with a tidy CSV of its plotted data and a machine-readable spec, so every chart can be re-rendered in any framework; the bundle is published alongside this paper. Version history: the June 2024 window (Part I, first version, November 5, 2026); the July 2019 extension and the COVID placebo (November 8); the seniority field through May 2026 and the all-releases figure (November 9).
Pipeline: DuckDB streaming aggregation (stage 1: CSV to parquet; stage 2: seven aggregate panels), then Python for fixed-effects estimation (alternating-projection demeaning, cluster-robust sandwich). Public inputs: Eloundou et al. (2024) occupation and task files from the OpenAI GPTs-are-GPTs repository; Felten, Raj and Seamans AIOE; Anthropic Economic Index releases (Hugging Face); model release calendar compiled from announcements. Occupation-level aggregates and code will be released; firm-level series with company identifiers are held back pending the Revelio redistribution terms.